Dow Jones technical analysis | The market remains bullish above 33,972
BY Janne Muta
|November 8, 2023Dow Jones technical analysis shows the market breaking higher after pausing the up move for a couple of days. Technology stocks are leading the rally with eight out of eleven S&P 500 sectors in green at the time of writing while Merck, Caterpillar and Apple are the top three stocks boosting the DJIA performance.
The bond market is moving higher and pushing the yields lower which helps the equities. This suggests the market participants do not believe the Fed will despite Kashkari's hawkish comments hike the rates.
Summary of This Dow Jones Technical Analysis Report:
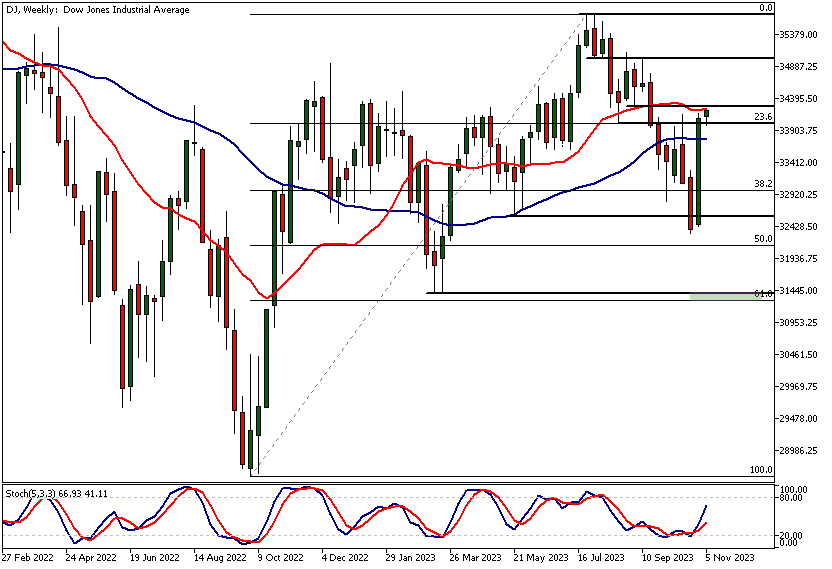
- The strong weekly candle indicates more upside for the Dow Jones Industrial Average. Look for a move to the 34,800 region as long as the index remains above 33,972.
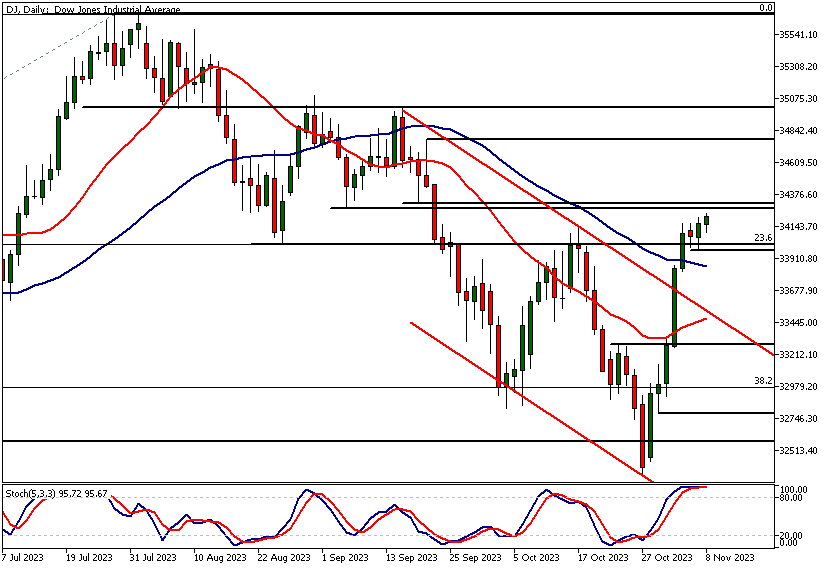
- The daily chart shows how the market has slowed down now that it trades near levels that used to act as support. The stochastic oscillator is now in the overbought territory. This has made the bulls more careful in bidding for the DJIA stocks and the Dow Jones index CFD.
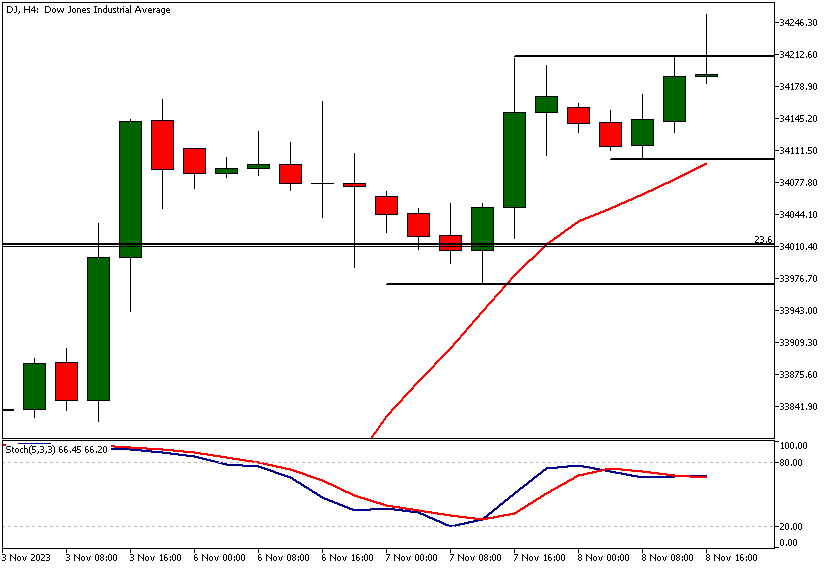
- The four-hour chart provides us with a quite similar technical picture with the Dow trading higher in this timeframe too. The nearest key support level is at 34,102.
Read the full Dow Jones Technical Analysis report below.
Dow Jones Technical Analysis
Weekly Dow Jones Technical Analysis
The strong weekly candle indicates more upside for the Dow Jones Industrial Average. Look for a move to the 34,800 region as long as the index remains above 33,972. The stochastic oscillator has given a buy signal and the Dow has pushed above a key market structure level at 34,023. Together with the strong momentum candle and the ability to push above this key price level, the Dow should be able to continue to rally.
Key confluence area
Dow Jones technical analysis shows, however, that in order to maintain the upside momentum the market needs to push itself above the confluence area created by the SMA(20) and a market structure level at 34,287. Should there be weakness in the Dow and the market moved decisively below 33,972 we could see it trading down to 33,825.
The nearest key resistance level above the SMA(20) is at 35,013 while the nearest weekly support level below the 34,023 market structure level can be found at 32,324.
Daily Dow Jones Technical Analysis
The daily chart shows how the market has slowed down now that it trades near levels that used to act as support. The stochastic oscillator is now in the overbought territory. This has made the bulls more careful in bidding for the DJIA stocks and the Dow Jones index CFD.
However, as long as the bulls are willing to continue buying above yesterday's low (33,972) the market is more likely to remain bullish. A decisive break below 33,972 could result in the market testing the bear channel top.
The nearest market structure levels are at 34,287 - 34,311 and a strong rally above the range would open the way to 34,700.
Dow Jones Technical Analysis, 4h
The four-hour chart provides us with a quite similar technical picture with the Dow creating higher lows. Note however that the last rally was faded by the bears suggesting an intraday correction in the Dow. The nearest key support level is at 34,102.
Based on the weekly Dow Jones technical analysis it seems likely that traders could buy the market near the 34,102 level if there was a retracement back to the level. If the level was violated though (decisively) we should look for a move to 33,972.
The next key risk events impacting this market:
- USD - Unemployment Claims
- USD - Prelim UoM Consumer Sentiment
- USD - Prelim UoM Inflation Expectations
Potential Dow Jones Market Moves
The strong weekly candle indicates more upside for the Dow Jones Industrial Average. Look for a move to the 34,800 region as long as the index remains above 33,972.
Should there be weakness in the Dow and the market moved decisively below 33,972 we could see it trading down to 33,825.

How would you trade the Dow Jones today?
I hope this fundamental and technical Dow Jones analysis helps you to make better informed trading decisions. Check the latest market analysis for other instruments and subscribe to receive them in your inbox as soon as they are published
DISCLAIMER: TIO Markets offers an exclusively execution-only service. The views expressed are for information purposes only. None of the content provided constitutes any form of investment advice. The comments are made available purely for educational and marketing purposes and do NOT constitute advice or investment recommendation (and should not be considered as such) and do not in any way constitute an invitation to acquire any financial instrument or product. TIOmarkets and its affiliates and consultants are not liable for any damages that may be caused by individual comments or statements by TIOmarkets analysis and assumes no liability with respect to the completeness and correctness of the content presented. The investor is solely responsible for the risk of his/her investment decisions. The analyses and comments presented do not include any consideration of your personal investment objectives, financial circumstances, or needs. The content has not been prepared in accordance with any legal requirements for financial analysis and must, therefore, be viewed by the reader as marketing information. TIOmarkets prohibits duplication or publication without explicit approval.

Janne Muta holds an M.Sc in finance and has over 20 years experience in analysing and trading the financial markets.
Related Posts


Trade responsibly: CFDs are complex instruments and come with a high risk of losing all your invested capital due to leverage.