EURAUD Technical Analysis | Weekly contra-trend rally
BY Janne Muta
|January 15, 2024EURAUD technical analysis - EURUSD rally slowed down last week after Christine Lagarde, President of the European Central Bank (ECB), highlighted the possibility of rate cuts if inflation consistently falls to the 2% target. She also mentioned that interest rates have likely reached their peak, although she did not specify when rates might decrease. Lagarde speaks again on Wednesday, Thursday and Friday this week.
While the RBA board have reiterated that whether further tightening is needed will depend upon the data and the assessment of risks Australia's futures market anticipates an RBA rate cut in August and possibly two by year-end. The key report this week is December's employment data, showing a gradual slowdown in the labour market.
In 2022, Australia added 44k jobs monthly, mostly full-time. In 2023, the monthly average fell to 40k, with half being full-time. Unemployment rose from a 3.4% low in late 2022 to 3.9% in November. Participation rates increased, indicating a workforce growing faster than job creation, partly due to immigration.
Summary of this EURAUD technical analysis report
- In the weekly timeframe, EURAUD trades at 1.6456, indicating a downtrend based on recent lower highs and lows. A contra-trend rally is possible, with a key level at 1.6516. If unable to rally above, a decline to 1.6270 and potentially 1.6128 could be likely, as per EURAUD technical analysis.
- EURAUD broke out of a bearish channel, rallying to 1.6453, aligning with the 50-period moving average. Recent higher daily lows and a bullish candle suggest potential overcoming of this resistance. A decisive break above 1.6480 is needed to sustain the uptrend, as per EURAUD technical analysis.
- EURAUD has been trending higher in an ascending trend channel after the market moved above the 50-period moving average and started creating higher reactionary lows above it. Currently, the market is trading close to a weekly resistance level, which caused the market to sell off last Thursday. The nearest key support level is at 1.6320. Above this level, look for a move to the 1.6480 - 1.6516 range.
Read our full EURAUD technical analysis report below.
EURAUD Technical Analysis
EURAUD Technical Analysis, Weekly
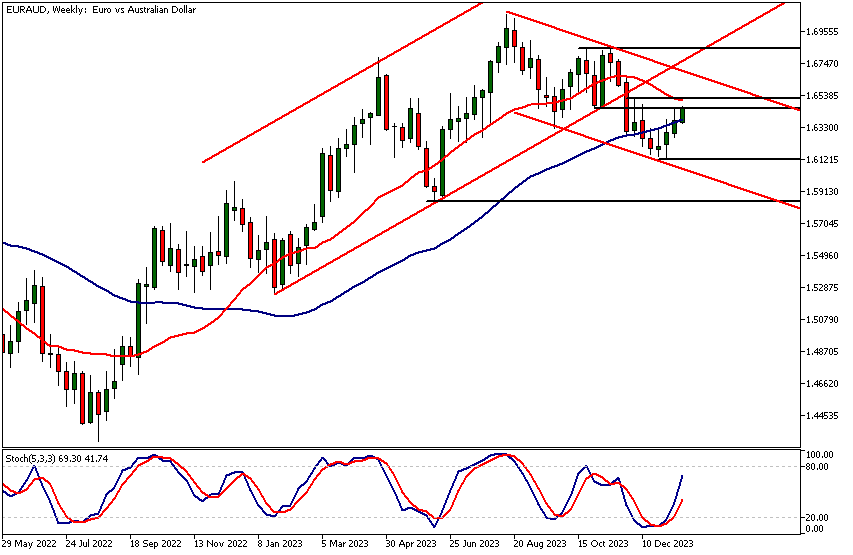
The weekly timeframe chart shows EURAUD trading at a weekly market structure level at 1.6456. Based on the recent lower reactionary highs and lows, the market is currently in a weekly downtrend, and the move higher over the last two weeks could be a contra-trend rally.
The moving average is closely aligned with a weekly high at 1.6516. EURAUD technical analysis suggests that if the market cannot rally above this level, it is more likely to trade down to 1.6270 and then perhaps to 1.6128.
EURAUD Technical Analysis, Daily
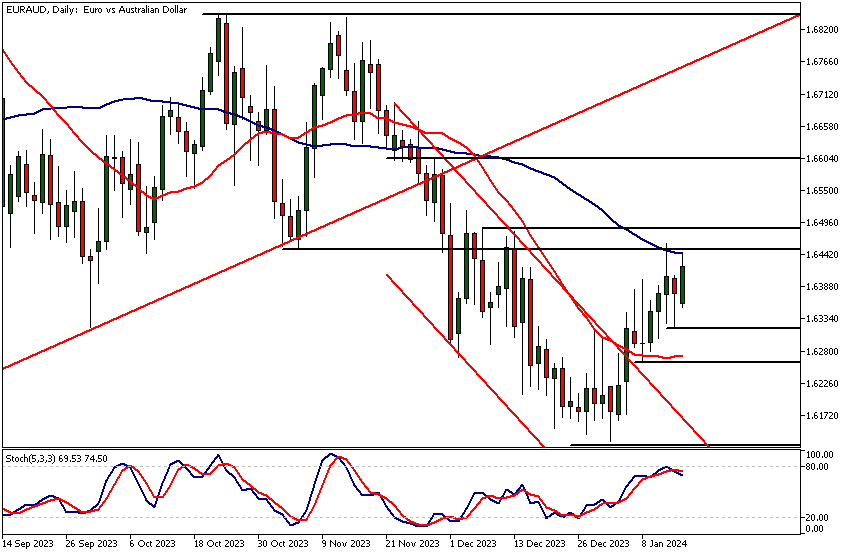
After breaking out of a bearish trend channel, EURAUD has rallied to a weekly timeframe resistance level (1.6453), coinciding with the 50-period moving average. The market has hesitated over the last two days below this level after the ECB President Lagarde said the central bank could be cutting rates if inflation continues falling.
A recent series of higher daily lows and Friday's bullish rejection candle, however, suggest that the bulls might be determined to push the market through the resistance level. Note, however, that above the 1.6453 resistance level, there is another resistance at 1.6480. Therefore, the market needs to decisively break above that level to continue the recent uptrend.
Intraday EURAUD Technical Analysis
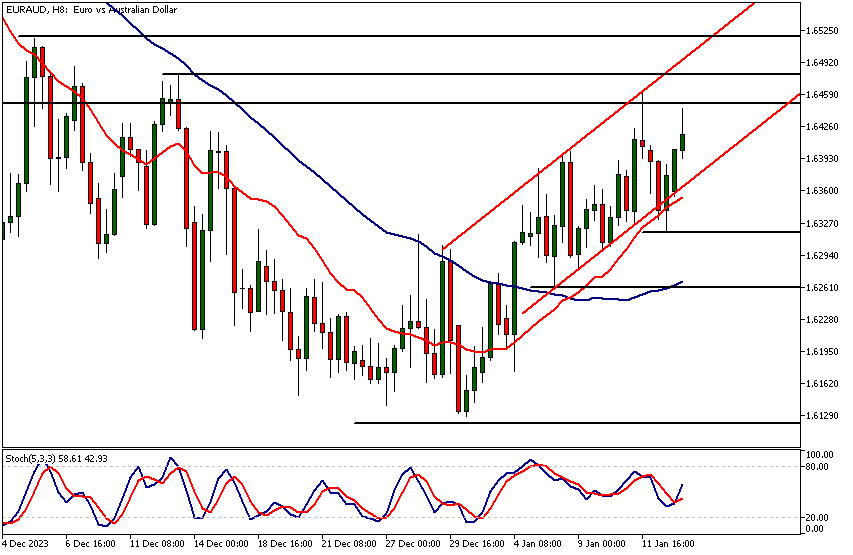
In the 8h chart EURAUD has been trending higher in an ascending trend channel after the market moved above the 50-period moving average and started creating higher reactionary lows above it.
Currently, the market is trading close to a weekly resistance level, which caused the market to sell off last Thursday. The nearest key support level is at 1.6320. Above this level, look for a move to the 1.6480 - 1.6516 range.
Alternatively, if the market creates a lower reactionary high below 1.6480, it is likely that the nearest support level at 1.6320 gets retested and possibly penetrated. Lower reactionary highs tend to lead to the nearest support level breaking. This could open the way down to 1.6270.
Moving averages-based EURAUD technical analysis suggests that the market is bullish, as the 20-period moving average is above the 50-period SMA.
Client sentiment analysis
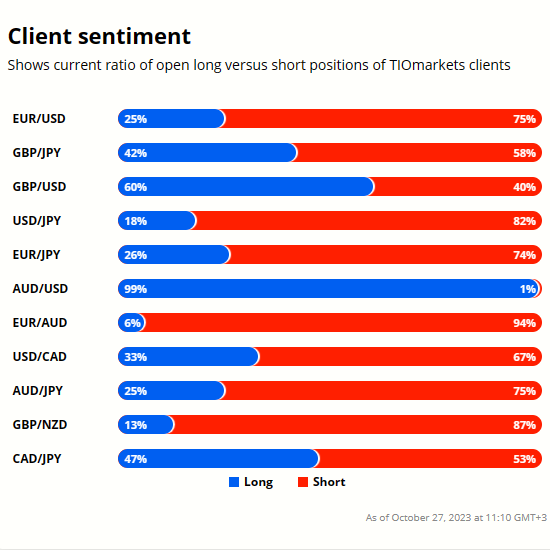
45% of clients trading EURAUD are holding long positions, while 55% are holding short positions. Client sentiment data is being provided by TIO Markets Ltd.
It’s good to remember that retail client trading sentiment is a contrarian indicator as most retail traders are on average trading against market price trends. This is why experienced traders tend to trade against the retail client sentiment. You can follow the TIOmarkets client sentiment live on our Forex dashboard.
The Next Key Risk Events
- EUR - ECB President Lagarde Speaks
- AUD - Employment Change
- AUD - Unemployment Rate
- EUR - ECB President Lagarde Speaks
- EUR - ECB President Lagarde Speaks
Potential EURAUD market moves
If EURAUD sustains momentum above the 1.6480 resistance, a move towards 1.6516 could be likely. Alternatively, a failure to breach 1.6480 may result in a retest and potential breach of the 1.6320 support, potentially leading to a further decline to 1.6270.
How would you trade EURAUD today?
I hope this fundamental and technical analysis of EURAUD helps you make better informed trading decisions. Check the latest market analysis for other instruments and subscribe to receive them in your inbox as soon as they are published
DISCLAIMER: TIO Markets offers an exclusively execution-only service. The views expressed are for information purposes only. None of the content provided constitutes any form of investment advice. The comments are made available purely for educational and marketing purposes and do NOT constitute advice or investment recommendation (and should not be considered as such) and do not in any way constitute an invitation to acquire any financial instrument or product. TIOmarkets and its affiliates and consultants are not liable for any damages that may be caused by individual comments or statements by TIOmarkets analysis and assumes no liability with respect to the completeness and correctness of the content presented. The investor is solely responsible for the risk of his/her investment decisions. The analyses and comments presented do not include any consideration of your personal investment objectives, financial circumstances, or needs. The content has not been prepared in accordance with any legal requirements for financial analysis and must, therefore, be viewed by the reader as marketing information. TIOmarkets prohibits duplication or publication without explicit approval.

Janne Muta holds an M.Sc in finance and has over 20 years experience in analysing and trading the financial markets.
Related Posts


Trade responsibly: CFDs are complex instruments and come with a high risk of losing all your invested capital due to leverage.