EURGBP Analysis | Daily shooting star at weekly resistance
BY Janne Muta
|November 17, 2023EURGBP Analysis – The recent strengthening of the EURGBP can be attributed to a more optimistic outlook for the EUR compared to the GBP. Pessimistic sentiment and economic projections for the UK has supported the euro's rise against the GBP.
Today’s UK retail sales report shows a fall of 0.3% month-over-month in October, following an upwardly revised 1.1% decrease in September and falling short of the market expectation of a 0.3% growth.
While UK GDP grows modestly consumer caution is evident in the continuous decline of retail sales, reflecting cost-of-living pressures and economic uncertainties.
The economy of the Euro area is grappling with sluggish expansion and enduring inflation issues. The year-on-year GDP growth is marginally positive at 0.1%, and there's a quarterly decline of 0.1% in Q3. Although overall inflation has reduced to 2.9%, the core inflation rate stays high at 4.2%, indicating continuous internal price pressures.
Summary of This EURGBP Analysis Report:
- EURGBP is trending higher in a bullish trend channel after breaking out of a base in September. The market is trading relatively close to a level where the bull channel high and a historical market structure level are closely aligned.
- While the EURGBP is trending higher, the risk of a corrective move has increased due to the market trading close to a higher timeframe resistance area. The nearest support and resistance levels are at 0.8650 and 0.8762.
- Yesterday's bearish shooting star candle, with a high at the 0.8762 market structure level could be an indication of market possibly correcting lower.
Read the full EURGBP analysis report below.
EURGBP Analysis
Weekly EURGBP Analysis
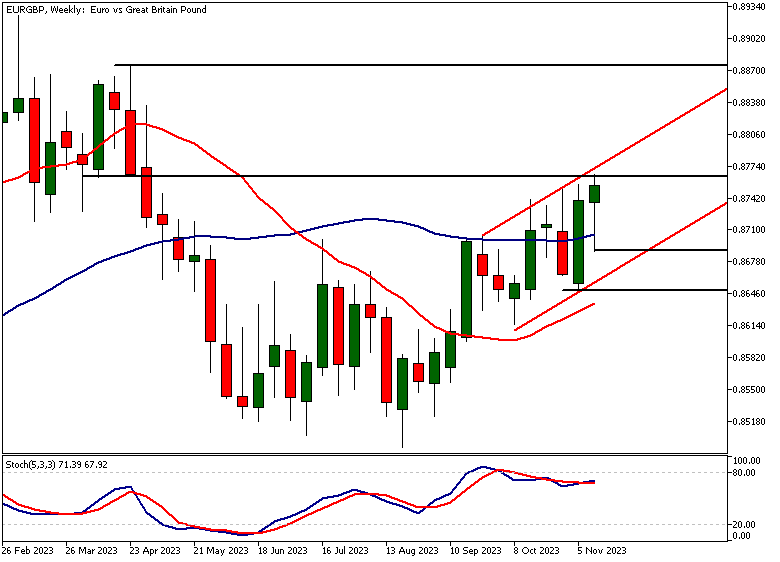
EURGBP is trending higher in a bullish trend channel after breaking out of a base in September. The market is trading relatively close to a level where the bull channel high and a historical market structure level are closely aligned.
While the market is trending higher, the risk of a corrective move has increased due to the EURGBP trading close to a higher timeframe resistance area. The nearest support and resistance levels are at 0.8650 and 0.8762.
New fund inflows
The higher lows and higher highs indicate new funds have been flowing into this market forcing traders to pay higher prices. Those focusing on indicator-based EURGBP technical analysis might have noticed how this shows in the moving averages (20 and 50 periods) as they are starting to point higher again.
The stochastic oscillator is near the overbought area which ties in with the market trading near to a resistance level.
Daily EURGBP Technical Analysis
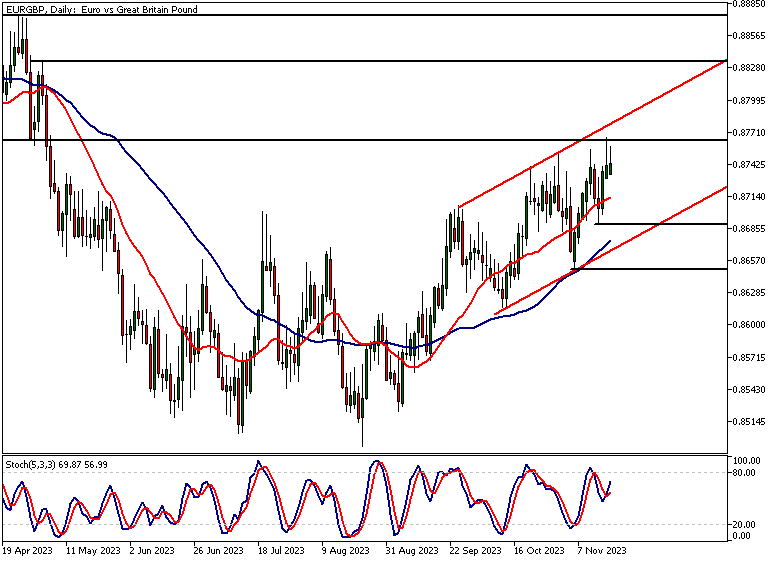
The uptrend in the EURGBP daily chart has been strong, with the latest higher swing low created three days ago at 0.8688. The bounce from the level was healthy, indicating the market remains bullish.
Indicator-oriented EURGBP technical analysis shows the market trending higher above the 50-period SMA, with the fast 20-period SMA also above the slower moving average.
Daily shooting star candle
Yesterday's bearish shooting star candle, with a high at the 0.8762 market structure level, raises some questions though. If the bulls can't push the market decidedly above yesterday's high and instead break below yesterday's low (0.8730), we could see a re-test of 0.8688. Should the market move lower, we could see it moving to around 0.8660.
Alternatively, our EURGBP technical analysis indicates that the market could move to 0.8830 if the bulls were able to push the market decidedly above yesterday's high and the bull channel top (currently at 0.8780).
EURGBP Analysis, 8h Chart
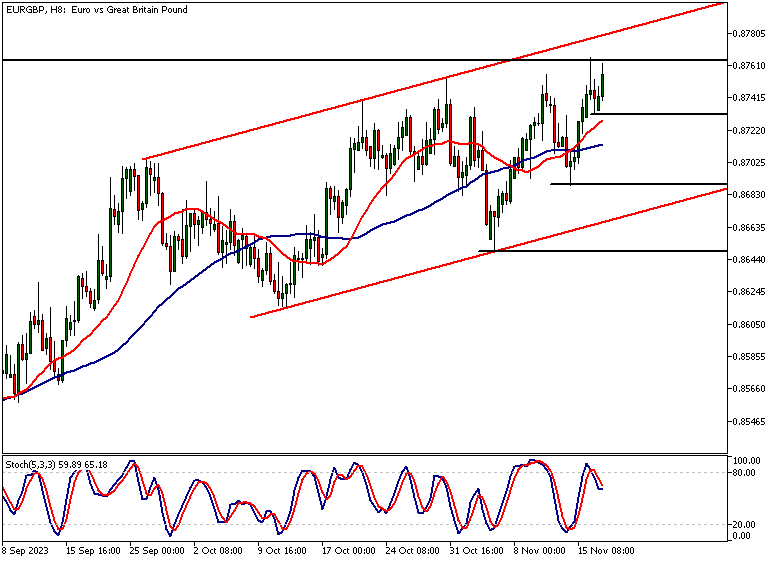
The 8h chart shows how the market has created a minor support level at 0.8731, with the SMA(20) relatively close by (at 0.8727). A decisive break below the 0.8727 - 0.8731 range could move the market down to 0.8688.
Above the SMA(20), we could see another push beyond the 0.8650 level. This is a market structure level identified in the weekly EURGBP technical analysis section above. Note also that the upper end of the bullish trend channel is now at 0.8780.
Client sentiment analysis
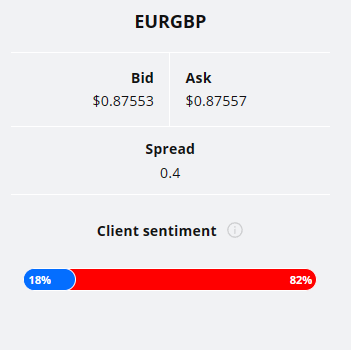
TIOmarkets' clients are quite bearish on EURGBP, with 82% of clients holding short positions and only 18% favouring the long side.
Please remember that the retail trad´+er client sentiment is a contrarian indicator as most of the retail traders are on average betting against the market trends. This is why, experienced traders tend to trade against the retail client sentiment. You can follow the TIOmarkets client sentiment live on our Forex dashboard.
The next key risk events impacting this market:
- EUR - ECB President Lagarde Speaks
- GBP - BOE Gov Bailey Speaks
- EUR - ECB President Lagarde Speaks
- EUR - ECB Financial Stability Review
- GBP - Autumn Forecast Statement
- GBP - Monetary Policy Report Hearings
- EUR - French Flash Manufacturing PMI
- EUR - French Flash Services PMI
- EUR - German Flash Manufacturing PMI
- EUR - German Flash Services PMI
- EUR - Flash Manufacturing PMI
- EUR - Flash Services PMI
- GBP - Flash Manufacturing PMI
- GBP - Flash Services PMI
- EUR - German ifo Business Climate
- EUR - ECB President Lagarde Speaks
Potential EURGBP Market Moves
Yesterday's bearish shooting star candle, with a high at the 0.8762 market structure level, raises some questions of whether the bulls are still in charge. If they can't push the market decidedly above yesterday's high and instead break below yesterday's low (0.8730), we could see a re-test of 0.8688. Should the market move even lower, we could see it moving down to around 0.8660.
Alternatively, our EURGBP technical analysis indicates that the market could move to 0.8830 if the bulls were able to push the market decidedly above yesterday's high and the bull channel top (currently at 0.8780).

How would you trade the EURGBP today?
I hope this fundamental and technical EURGBP analysis helps you to make better informed trading decisions. Check the latest market analysis for other instruments and subscribe to receive them in your inbox as soon as they are published
DISCLAIMER: TIO Markets offers an exclusively execution-only service. The views expressed are for information purposes only. None of the content provided constitutes any form of investment advice. The comments are made available purely for educational and marketing purposes and do NOT constitute advice or investment recommendation (and should not be considered as such) and do not in any way constitute an invitation to acquire any financial instrument or product. TIOmarkets and its affiliates and consultants are not liable for any damages that may be caused by individual comments or statements by TIOmarkets analysis and assumes no liability with respect to the completeness and correctness of the content presented. The investor is solely responsible for the risk of his/her investment decisions. The analyses and comments presented do not include any consideration of your personal investment objectives, financial circumstances, or needs. The content has not been prepared in accordance with any legal requirements for financial analysis and must, therefore, be viewed by the reader as marketing information. TIOmarkets prohibits duplication or publication without explicit approval.

Janne Muta holds an M.Sc in finance and has over 20 years experience in analysing and trading the financial markets.
Related Posts


Trade responsibly: CFDs are complex instruments and come with a high risk of losing all your invested capital due to leverage.