EURUSD Analysis | Increased Fed rate cut expectations support EUR
BY Janne Muta
|November 9, 2023EURUSD Analysis - EURUSD attracted buyers on an intraday dip yesterday as the dollar-index rally faltered at a resistance level and the USD yields continued to decline. While the recent EU retail sales and GDP numbers have been weak it is the Fed rate cut expectations that seem to have been driving the EURUSD higher.
EURUSD has been catching a bid over the last weeks after the Fed Funds Futures trades started to price in more rate cuts for next year. Currently futures traders are betting the Fed will cut rates three times, starting from June.
Summary of This EURUSD Analysis Report:
- EURUSD rallied 1.5% last week, recording the biggest weekly rise since July. Such an up move could lead to follow-through buying that could eventually take the market to 1.0920. Alternatively, if the market fails to attract buying and drops below 1.0660), we could see the market trading down to 1.0520 or so.
- The daily chart reveals a successful test of a support level at 1.0660. EURUSD moved down to this level yesterday and bounced higher, creating a bullish rejection candle in the daily chart.
- The 4h chart shows the market trading between the 1.0660 support level and a minor resistance level at 1.0716. Technically we have a higher swing low at 1.0660 which is also a daily timeframe low. Therefore, the market remains bullish above 1.0660.
Read the full EURUSD analysis report below.
EURUSD Analysis
Weekly EURUSD Analysis
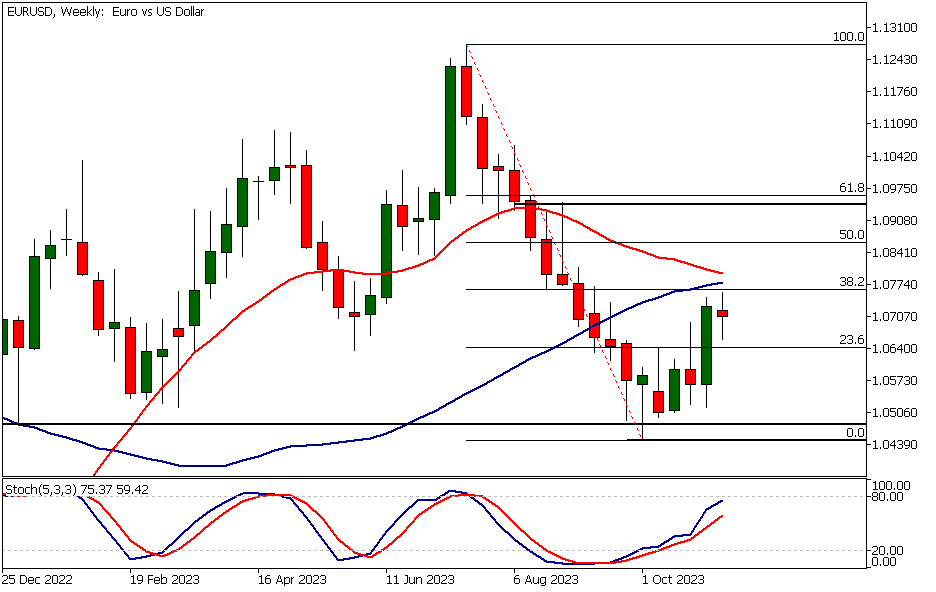
EURUSD rallied 1.5% last week, recording the biggest weekly rise since the exhaustion rally in July that led to EURUSD forming a market top. Such an up move could lead to follow-through buying that could eventually take the market to 1.0920. Alternatively, if the market fails to attract buying and drops below 1.0660), we could see the market trading down to 1.0520 or so.
Potential upside in EURUSD?
The strong up move last week comes after the currency pair started to reverse its recent downtrend. Our EURUSD analysis indicates that a strong rally after a reversal adds to the evidence that the market could be more likely to move higher. In other words, the line of least resistance seems to be to the upside.
This week the rally has slowed down below a confluence area where the 50-period moving average and the 38.2% Fibonacci retracement level are closely aligned. The next confluence area above this can be found at 1.0945 - 1.0960. This is where a market structure level and the 61.8% Fibonacci retracement level coincide.
Daily EURUSD Technical Analysis
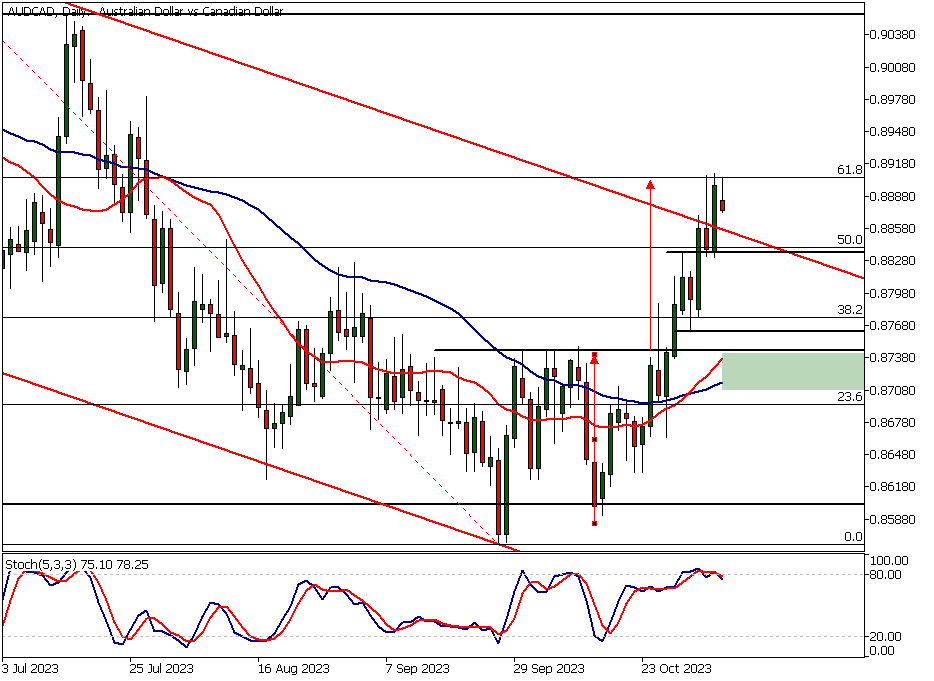
The daily chart reveals a successful test of a support level at 1.0660. EURUSD moved down to this level yesterday and bounced higher, creating a bullish rejection candle in the daily chart.
As the market is now trading above the moving averages, as well as the recent sideways movement, it looks more likely that we could see another attempt to penetrate the 1.0769 resistance level.
Key price level
This level coincides with the 38.2% Fibonacci retracement level and is, as such, a level that is likely to attract more attention than support and resistance levels.
Our EURUSD analysis indicates that a decisive rally above the 1.0769 level could propel the market to 1.0855 and then perhaps to 1.0945 on extension. Alternatively, a daily close below 1.0667 would indicate weakness and might push the market down to 1.0520.
EURUSD Analysis, 4h Chart
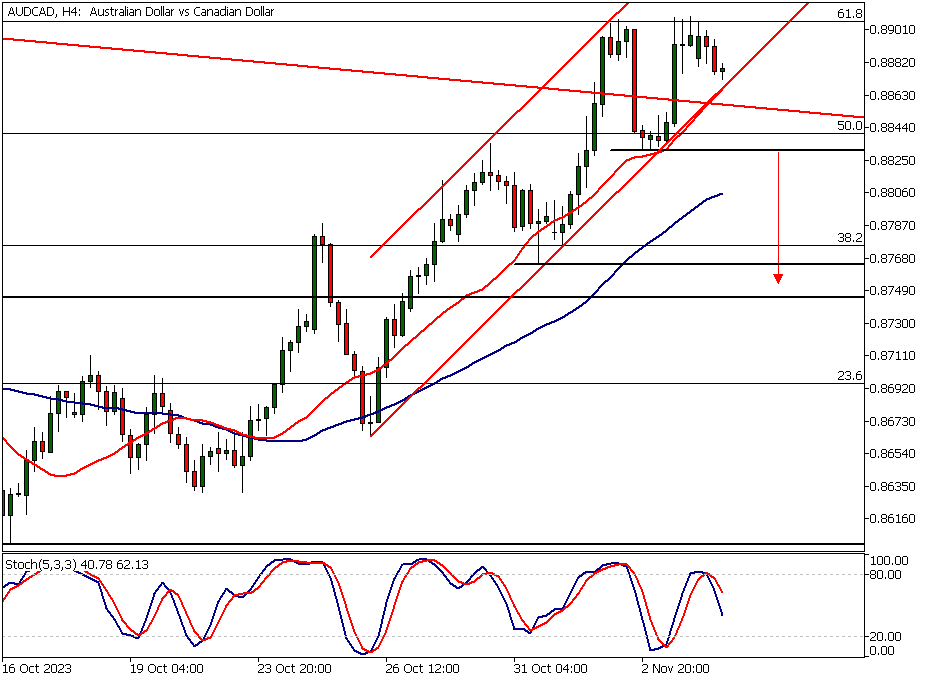
The 4h chart shows the market trading between the 1.0660 support level and a minor resistance level at 1.0716. Technically we have a higher swing low at 1.0660 which is also a daily timeframe low. Therefore, the market remains bullish above this level (1.0660).
However, the bulls need to be able to push the market above 1.0716 to maintain the upside momentum. Our EURUSD analysis suggests, based on the weekly and daily timeframe charts, that this could be the more probable outcome.
Monitoring price action
However, nothing is certain in the markets before it has happened. Therefore, we will keep on monitoring trading patterns in the intraday charts to get clues on whether the market can indeed either push above yesterday’s high (1.0716) or attract buyers on a potential retracement towards yesterday’s low (1.0660).
Client sentiment analysis
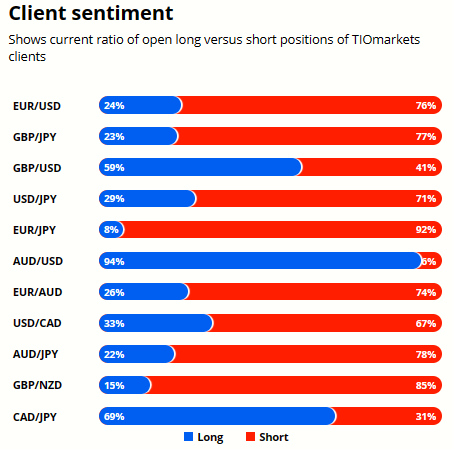
TIOmarkets' clientele are bearish on EURUSD , with 76% of clients holding short positions and 24% favouring the long side.
Please remember that the retail trader client sentiment is a contrarian indicator as most of the retail traders are on average betting against the market trends. This is why, experienced traders tend to trade against the retail client sentiment. You can follow the TIOmarkets client sentiment live on our Forex dashboard.
The next key risk events impacting this market:
- USD - Unemployment Claims
- ECB President Lagarde's Speech
- Fed Chair Powell's Speech
- USD - Prelim UoM Consumer Sentiment
- USD - Prelim UoM Inflation Expectations
Potential EURUSD Market Moves
EURUSD rallied 1.5% last week, recording the biggest weekly rise since July. Such an up move could lead to follow-through buying that could eventually take the market to 1.0920.
Alternatively, if the market fails to attract buying and drops below 1.0660), we could see the market trading down to 1.0520 or so.

How would you trade the EURUSD today?
I hope this fundamental and technical EURUSD analysis helps you to make better informed trading decisions. Check the latest market analysis for other instruments and subscribe to receive them in your inbox as soon as they are published
DISCLAIMER: TIO Markets offers an exclusively execution-only service. The views expressed are for information purposes only. None of the content provided constitutes any form of investment advice. The comments are made available purely for educational and marketing purposes and do NOT constitute advice or investment recommendation (and should not be considered as such) and do not in any way constitute an invitation to acquire any financial instrument or product. TIOmarkets and its affiliates and consultants are not liable for any damages that may be caused by individual comments or statements by TIOmarkets analysis and assumes no liability with respect to the completeness and correctness of the content presented. The investor is solely responsible for the risk of his/her investment decisions. The analyses and comments presented do not include any consideration of your personal investment objectives, financial circumstances, or needs. The content has not been prepared in accordance with any legal requirements for financial analysis and must, therefore, be viewed by the reader as marketing information. TIOmarkets prohibits duplication or publication without explicit approval.

Janne Muta holds an M.Sc in finance and has over 20 years experience in analysing and trading the financial markets.
Related Posts


Trade responsibly: CFDs are complex instruments and come with a high risk of losing all your invested capital due to leverage.