FTSE 100 Technical Analysis | Growth in services helps to stabilize the economy
BY Janne Muta
|November 24, 2023FTSE 100 technical analysis - The PMIs released yesterday indicate that the UK economy is stabilizing after declining over the previous three months. This stabilization is primarily due to growth in the service sector, which offsets a smaller downturn in manufacturing. The Flash UK PMI Composite Output Index suggests a balance between expansion and contraction.
However, rising inflation—particularly in the service sector—and subdued demand remain key concerns. Manufacturing is challenged by lower production and order intakes. Employment is stable, with slight growth in service sector jobs.
Export sales in both sectors have fallen, reflecting difficulties in compensating for domestic demand gaps. Overall, the economic outlook is cautiously optimistic but overshadowed by inflation, weak demand, and global uncertainties.
The UK economy's stabilization supports the FTSE 100. However, rising inflation, particularly in services, heightens the risk of further Bank of England tightening. This potential for increased interest rates could dampen economic activity, posing a counterbalance to FTSE 100 growth.
Summary of This FTSE 100 Technical Analysis Report:
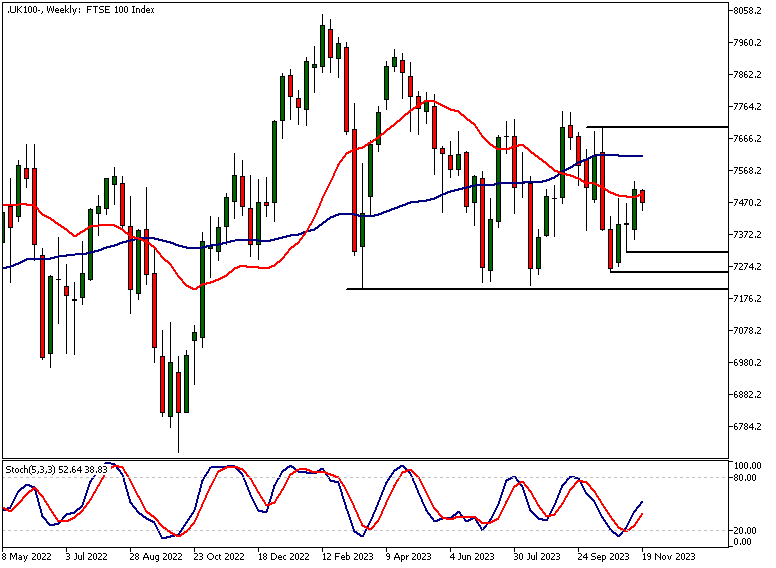
- The FTSE 100 index is moving sideways in a sizable price range between 7203 and 7747. Four weeks ago, the market started attracting buyers at 7256, creating a higher swing low in the weekly chart.
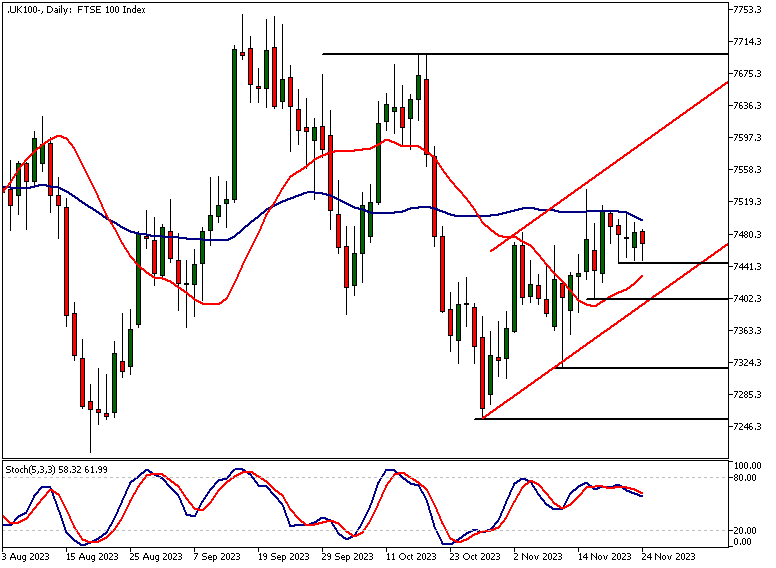
- In the daily chart, the FTSE 100 index has created two higher swing lows since the October 27th low. This indicates that the market is bullish and could still attract more buying.
- FTSE has a long bias as market operators are betting the drop in retail sales and slowing inflation means the BoE will not hike the rates again.
Read the full FTSE 100 technical analysis report below.
FTSE 100 technical analysis
Weekly FTSE 100 technical analysis
The FTSE 100 rally has slowed this week, following a performance exceeding 1.6% in the previous week. The market hasn’t rallied, but it hasn't sold off either. If it now closes above 7,357, it will have created another higher weekly low value, indicating that the market bias remains positive.
The FTSE 100 has gained approximately 3% since creating a higher swing low four weeks ago. For the last four weeks the market has been trading higher from levels near a range low, suggesting potential for further upside. Key weekly support and resistance levels are at 7,318 and 7,700, respectively.
Daily FTSE 100 technical analysis
The daily chart shows the market creating higher lows, even though it has not managed a higher high this week. Price advances have been limited by the 50-period moving average.
Overall, the technical picture is positive. For the uptrend to continue, the market needs to break above the 50-period SMA decisively and sustain momentum above this moving average, potentially leading to 7,580.
Alternative target
Alternatively, if the market breaks below the nearest support level at 7,448, a move to the next key support level at 7,402 could occur. This level coincides with the bull channel low, adding to its technical significance.
Indicator-based FTSE 100 technical analysis suggests a mildly bullish market, as the 20-period moving average points higher and the market trades above it. However, the 50-period moving average is moving sideways, reflecting the market's sideways movement on the weekly chart.
FTSE 100 technical analysis, 4h chart
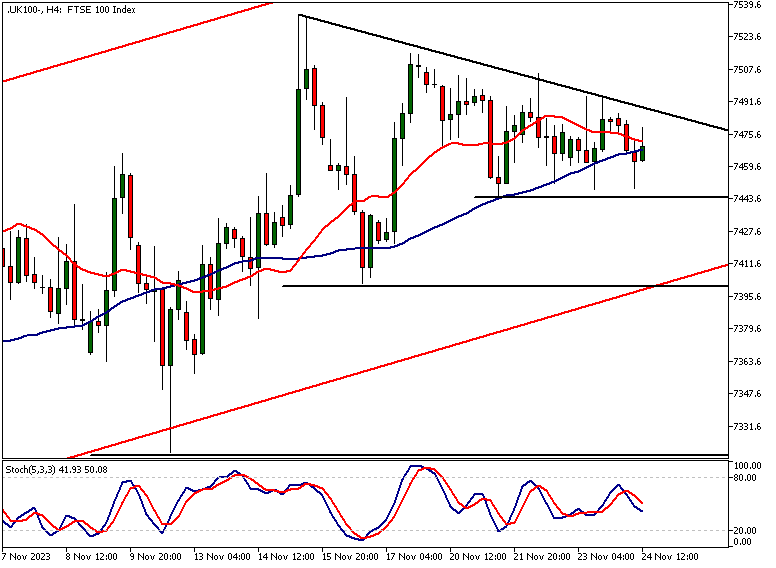
Lower swing highs in the 4-hour chart have created a triangle formation. If resolved to the upside, the market could move to 7,549. Alternatively, a decisive break below the triangle formation could lead the market to 7,384.
These potential price targets are based on a measured move analysis, where the width of the triangle formation indicates how far the market could move once it breaks out of the formation.
Technical indicators
The 20-period moving average and the 50-period SMA are pointing higher in this timeframe. The 20-period SMA is slightly above the 50-period SMA, indicating that the market is trending higher, but with diminishing momentum as the fast-moving average converges with the slow.
This indicator-based FTSE 100 technical analysis reflects the price action analysis quite accurately, with the contraction in the moving averages occurring as the market moves inside the triangle formation.
The next key risk events impacting this market:
- BOE Gov Bailey Speaks
- Construction PMI
- Claimant Count Change
- Average Earnings Index
- GDP
- Monetary Policy Summary
- MPC Official Bank Rate Votes
- Official Bank Rate

Potential FTSE 100 Market Moves
For the uptrend to continue, the market needs to break above the 50-period SMA decisively and sustain momentum above this moving average, potentially leading to 7,580. Alternatively, if the market breaks below the nearest support level at 7,448, a move to the next key support level at 7,402 could occur.
How would you trade the FTSE 100 today?
I hope this FTSE 100 technical analysis helps you to make better informed trading decisions. Check the latest market analysis for other instruments and subscribe to receive them in your inbox as soon as they are published
DISCLAIMER: TIO Markets offers an exclusively execution-only service. The views expressed are for information purposes only. None of the content provided constitutes any form of investment advice. The comments are made available purely for educational and marketing purposes and do NOT constitute advice or investment recommendation (and should not be considered as such) and do not in any way constitute an invitation to acquire any financial instrument or product. TIOmarkets and its affiliates and consultants are not liable for any damages that may be caused by individual comments or statements by TIOmarkets analysis and assumes no liability with respect to the completeness and correctness of the content presented. The investor is solely responsible for the risk of his/her investment decisions. The analyses and comments presented do not include any consideration of your personal investment objectives, financial circumstances, or needs. The content has not been prepared in accordance with any legal requirements for financial analysis and must, therefore, be viewed by the reader as marketing information. TIOmarkets prohibits duplication or publication without explicit approval.

Janne Muta holds an M.Sc in finance and has over 20 years experience in analysing and trading the financial markets.
Related Posts


Trade responsibly: CFDs are complex instruments and come with a high risk of losing all your invested capital due to leverage.