FTSE 100 Technical Analysis | Higher swing lows in the daily chart
BY Janne Muta
|November 20, 2023FTSE 100 technical analysis - The UK's main stock index, the FTSE 100 rallied by 1% on Friday even though retail sales data suddenly dropped in October. For the week FTSE 100 recorded a healthy 1,57% gain. This is the second strong weekly gain since the down move in the market was reversed four weeks ago.
According to Reuters Market participants were optimistic about a potential peak in interest rates due to cooling inflation and signs of economic growth softening. Soft retail sales in the UK in October raised concerns about consumer sentiment and traders began pricing in the possibility of interest rate cuts in response to this data.
Friday's rally was further helped by the oil prices recovering after the USOIL had moved into a base formation created in the May-June period.
Summary of This FTSE 100 Technical Analysis Report:
- The FTSE 100 index is moving sideways in a sizable price range between 7203 and 7747. Four weeks ago, the market started attracting buyers at 7256, creating a higher swing low in the weekly chart.
- In the daily chart, the FTSE 100 index has created two higher swing lows since the October 27th low. This indicates that the market is bullish and could still attract more buying.
- FTSE has a long bias as market operators are betting the drop in retail sales and slowing inflation means the BoE will not hike the rates again.
Read the full FTSE 100 technical analysis report below.
FTSE 100 technical analysis
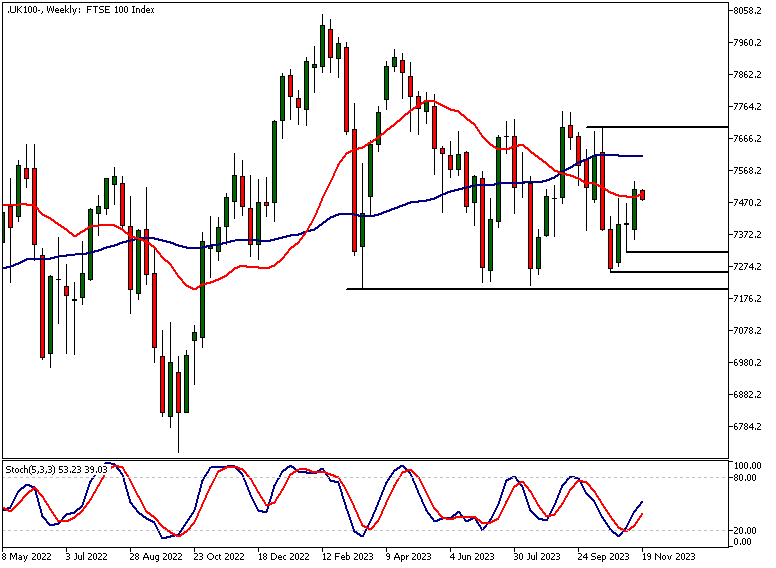
Weekly FTSE 100 technical analysis
The FTSE 100 index is moving sideways in a sizable price range between 7203 and 7747. Four weeks ago, the market started attracting buyers at 7256, creating a higher swing low in the weekly chart.
Two weeks ago, the market had created three consecutive weekly candles with higher lows, which resulted in the stochastic oscillator giving a Buy Signal.
Potential price targets
The FTSE 100 technical analysis shows how the market has been pushing slowly higher, and if the momentum can be sustained, we could see a move to 7590. Alternatively, we could see the market retracing back to the 7318 low.
If the market moves down to this weekly low, we should monitor the price action in order to see if the bulls are willing to re-engage with the market. Below 7318, a move to 7300 could take place.
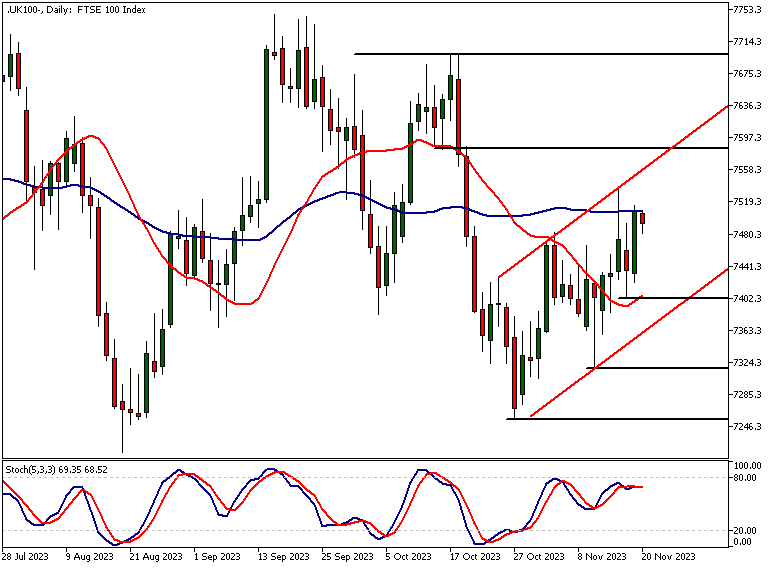
Daily FTSE 100 technical analysis
In the daily chart, the FTSE 100 index has created two higher swing lows since the October 27th low. This indicates that the market is bullish and could still attract more buying.
Above the 7402 swing low, the bias is bullish, and the market could be targeting the upper end of the bullish trend channel, currently at 7556. Should the market fail to attract buyers at 7402, we could see it retesting the bull channel low at 7363.
SMA(20) turning higher
Indicator-based FTSE 100 technical analysis points to the market trading above the 20-period moving average, with the DSMA 20 starting to turn higher. Friday's rally was thwarted at the 50-period SMA, but this doesn't change the technical picture unless the market fails to penetrate the SMA(50) in the days to come.
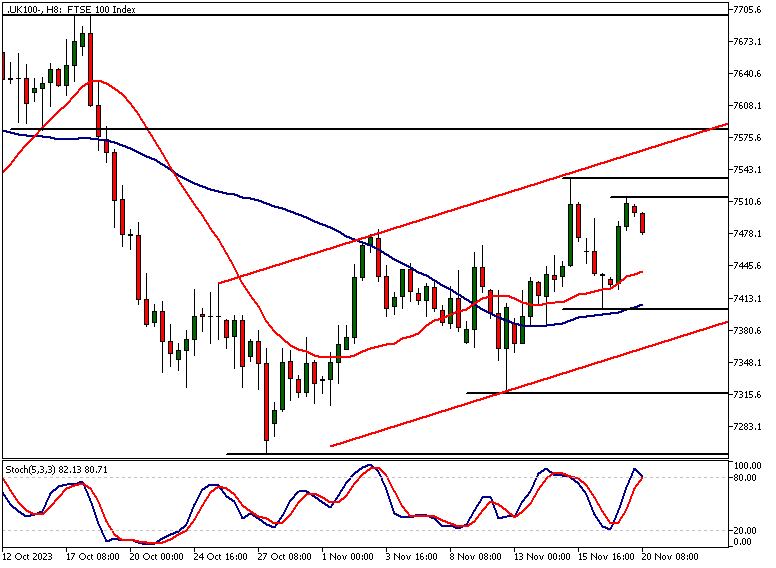
FTSE 100 technical analysis, 8h chart
The 8h chart shows the FTSE 100 index possibly creating a lower swing high at 7515. If this weakness continues, we might see a move down to 7425. If the market attracts renewed buying above 7402, we could see it pushing beyond the 7534 high. Below 7402, a move to 7364 could take place.
Those focusing on indicator-based FTSE 100 technical analysis should note that the stochastic oscillator is about to give a sell signal after moving into the overbought zone. Both moving averages are pointing higher, with the 20-period SMA above the 50-period SMA. The indication is that the market is trending higher, but could be momentarily overbought.
Note, however, that shorting an up trending market based on an overbought reading in the oscillator would be a risky move.
The next key risk events impacting this market:
- BOE Gov Bailey Speaks
- UK Monetary Policy Report Hearings
- FOMC Meeting Minutes
- Autumn Forecast Statement
- Flash Manufacturing PMI
- Flash Services PMI

Potential FTSE 100 Market Moves
Above the 7402 swing low, the bias is bullish, and the market could be targeting the upper end of the bullish trend channel, currently at 7556. Should the market fail to attract buyers at 7402, we could see it retesting the bull channel low at 7363.
How would you trade the FTSE 100 today?
I hope this FTSE 100 technical analysis helps you to make better informed trading decisions. Check the latest market analysis for other instruments and subscribe to receive them in your inbox as soon as they are published
DISCLAIMER: TIO Markets offers an exclusively execution-only service. The views expressed are for information purposes only. None of the content provided constitutes any form of investment advice. The comments are made available purely for educational and marketing purposes and do NOT constitute advice or investment recommendation (and should not be considered as such) and do not in any way constitute an invitation to acquire any financial instrument or product. TIOmarkets and its affiliates and consultants are not liable for any damages that may be caused by individual comments or statements by TIOmarkets analysis and assumes no liability with respect to the completeness and correctness of the content presented. The investor is solely responsible for the risk of his/her investment decisions. The analyses and comments presented do not include any consideration of your personal investment objectives, financial circumstances, or needs. The content has not been prepared in accordance with any legal requirements for financial analysis and must, therefore, be viewed by the reader as marketing information. TIOmarkets prohibits duplication or publication without explicit approval.

Janne Muta holds an M.Sc in finance and has over 20 years experience in analysing and trading the financial markets.
Related Posts


Trade responsibly: CFDs are complex instruments and come with a high risk of losing all your invested capital due to leverage.