FTSE 100 Technical Analysis | Which direction will the range be resolved?
BY Janne Muta
|November 13, 2023FTSE 100 technical analysis - The FTSE 100 performance has been subdued this year as the economy has stuttered. The UK GDP growth is modest at 0.6% year-over-year, with services and construction sectors showing positive yet quite modest growth.
The Services PMI remains below 50, indicating a contraction driven by high interest rates and cost of living pressures. Retail sales increased by 2.6% year-over-year in October, a slowdown reflecting cautious consumer behaviour amid high living costs.
Inflation is a significant concern, with the CPI increasing 0.5% month-over-month in September, though October's CPI is expected to decrease to 4.7%, potentially the lowest in two years. As a result, the Bank of England has maintained a high interest rate of 5.25%, balancing between controlling inflation and supporting growth.
Upcoming reports on employment, wages, and retail sales this week are anticipated to show a cooling labour market and lower-than-expected retail performance, underscoring the challenges facing the UK economy.
Summary of This FTSE 100 Technical Analysis Report:
- The market is fluctuating near a key support level that has triggered rallies three times since March. A breakout to the upside could target the SMA50 level at 7608, while a downward breakout below 7203 might lead to a drop to 7100.
- The FTSE 100 index showed an initial rally but has been fluctuating sideways. For the bullish optimism to continue, it needs to surpass 7482.
- The 8-hour chart mirrors the daily chart, showing the market moving sideways and aiming for a higher swing low at 7318. A decisive break above 7420 could lead to a rally to 7482, while falling below 7418 might see it drop to 7270.
Read the full FTSE 100 technical analysis report below.
FTSE 100 technical analysis
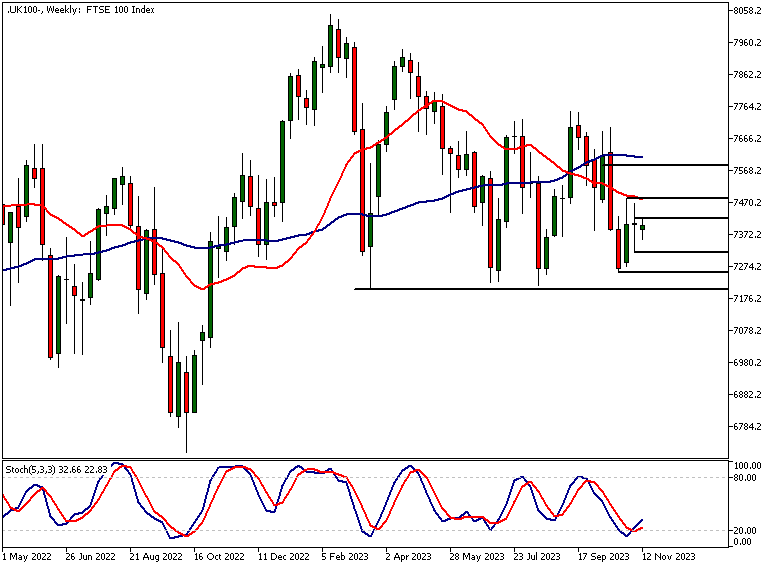
Weekly FTSE 100 technical analysis
The weekly chart shows the market moving sideways, relatively close to a major support level that has turned the market higher on three occasions since March this year.
If the sideways movement is resolved to the upside, we could see a rally towards the levels where the SMA50 is at the moment (7608). Alternatively, if the sideways move is resolved to the downside and the market breaks decisively below 7203, FTSE 100 technical analysis indicates we could see the market moving down to 7100.
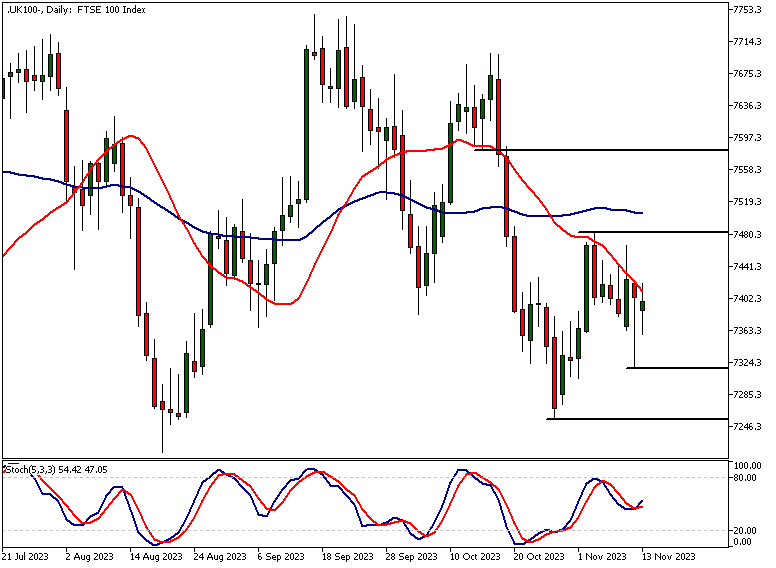
Daily FTSE 100 technical analysis
The FTSE 100 index rallied nicely at the end of October but has since then fluctuated sideways. Three weeks ago, the Bulls rushed into buying the market slightly above the August low, but they were overpowered fairly quickly, and the market has since struggled to regain upside momentum.
Higher swing low?
Friday's intraday dip to 7318 was quickly bought, and the market rallied higher, closing only slightly below the opening levels on Friday. The long wick in the candle is bullish, but FTSE 100 technical analysis suggests that in order for the market to keep on rallying, it needs to close well above the resistance level at 7482.
If the market keeps on consolidating between the October low at 7256 and the November high at 7482, it is a sign of lack of commitment in the market by the Bulls. In order for the Bulls to stay optimistic about the market, the FTSE 100 needs to create a higher low above 7318. A decisive break above 7482 could lead to the market rallying to 7540. Below 7318, look for a move to 7256.
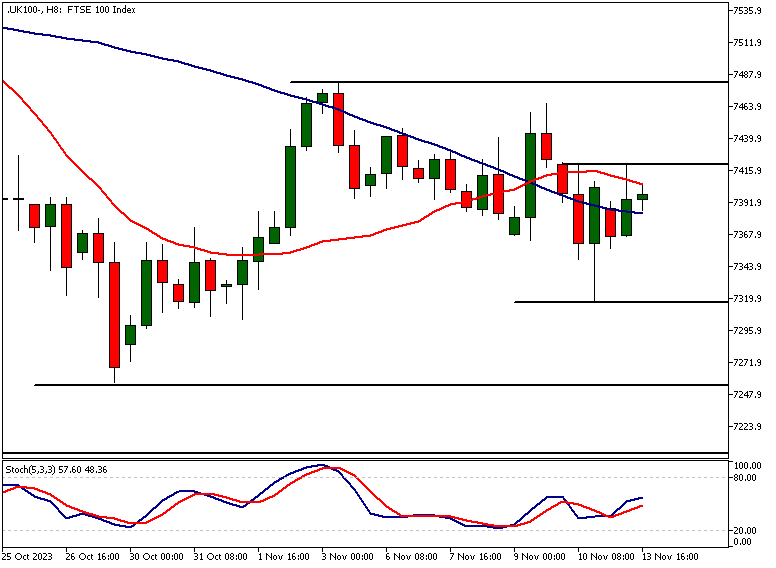
FTSE 100 technical analysis, 8h chart
The 8-hour chart provides a fairly similar technical picture to the daily chart, with the market moving sideways and trying to create a higher swing low at 7318.
Since the low was established on Friday, the rallies have been limited by a resistance level at 7420. Should there be a decisive break above this level, FTSE 100 technical analysis indicates the market could rally to the November high at 7482. Alternatively, below the low of 7418, a move down to 7270 is plausible.
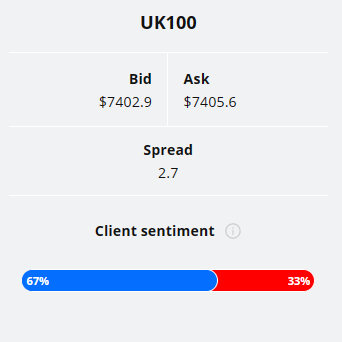
Client sentiment analysis
The Client Sentiment indicator shows TIOmarkets' are clients bullish on FTSE 100 with 67% long and 33% short the market.
Please remember that the retail trader client sentiment is a contrarian indicator as most of the retail traders are on average betting against the market trends. This is why, experienced traders tend to trade against the retail client sentiment. You can follow the TIOmarkets client sentiment live on our Forex dashboard.
The key risk events impacting this market today:
- Claimant Count Change
- Average Earnings Index
- US CPI
- UK CPI

Potential FTSE 100 Market Moves
If the sideways movement is resolved to the upside, we could see a rally towards the levels where the SMA50 is at the moment (7608).
Alternatively, if the sideways move is resolved to the downside and the market breaks decisively below 7203, we could see the market moving down to 7100.
How would you trade the FTSE 100 today?
I hope this fundamental and technical FTSE 100 analysis helps you to make better informed trading decisions. Check the latest market analysis for other instruments and subscribe to receive them in your inbox as soon as they are published
DISCLAIMER: TIO Markets offers an exclusively execution-only service. The views expressed are for information purposes only. None of the content provided constitutes any form of investment advice. The comments are made available purely for educational and marketing purposes and do NOT constitute advice or investment recommendation (and should not be considered as such) and do not in any way constitute an invitation to acquire any financial instrument or product. TIOmarkets and its affiliates and consultants are not liable for any damages that may be caused by individual comments or statements by TIOmarkets analysis and assumes no liability with respect to the completeness and correctness of the content presented. The investor is solely responsible for the risk of his/her investment decisions. The analyses and comments presented do not include any consideration of your personal investment objectives, financial circumstances, or needs. The content has not been prepared in accordance with any legal requirements for financial analysis and must, therefore, be viewed by the reader as marketing information. TIOmarkets prohibits duplication or publication without explicit approval.

Janne Muta holds an M.Sc in finance and has over 20 years experience in analysing and trading the financial markets.
Related Posts


Trade responsibly: CFDs are complex instruments and come with a high risk of losing all your invested capital due to leverage.