GBPJPY Technical Analysis | The Bullish Trend Continues
BY Janne Muta
|November 6, 2023GBPJPY Technical Analysis - Last week the BoJ held its key interest rate at -0.1% and the 10-year bond yield target at 0%, softening the 1.0% yield cap to a flexible upper bound. The Bank of Japan held back from aggressive policy changes amid disappointing economic data, suggesting a potential Q3 contraction.
GBPJPY rallied strongly after the BoJ meeting as the UK inflation still remains high (the highest in G7). The central bank underscored its commitment to maintaining a tight monetary stance over a prolonged period to guide inflation toward its 2% goal. Concurrently, UK inflation estimates were modestly increased.
Today's construction PMI coming in at 45.6 suggests a continued contraction in the sector. With housing and civil engineering declining sharply and job growth slowing the data indicates the UK economy is weakening further.
Summary of This GBPJPY Technical Analysis Report:
- GBPJPY continues the weekly uptrend breaking above a key level at 183.81, now support. With bullish moving averages and despite an overbought Stochastic Oscillator the uptrend might continue.
- GBPJPY has broken a key resistance level and trades now within a bullish channel in the daily chart. The bulls could be targeting 186.00 - 186.25 confluence area, while a pullback may retest 183.81 or 182.73 support levels.
- GBPJPY is trending up in a minor bullish channel in the 4h chart, with moving averages pointing up. Support is at 184.35, with channel low and SMA(20) near 183.33/183.81, and resistance at 186.00 - 186.25.
Read the full GBPJPY technical analysis report below.
GBPJPY Technical Analysis
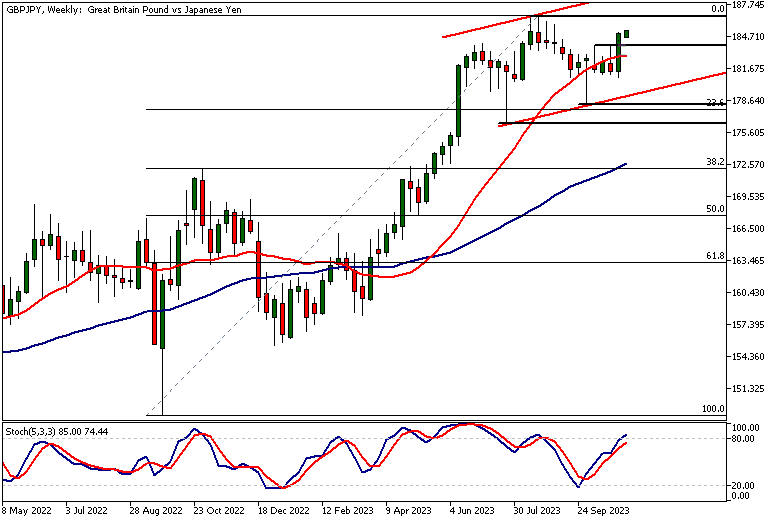
Weekly GBPJPY Technical Analysis
GBPJPY has gained 24% since the major low in August 2022 plus the market has rallied nicely since the time of our last GBPJPY technical analysis report. At the time we anticipated a further up move in this market. The higher reactionary trough at 178.21 suggested that the bulls were in charge and now the market has broken above a key market structure level at 183.81.
This key price level is now a support level that, should the market retrace back to it might attract buyers. Above this level, we should look for a move to 186.50 while below the level a move to 182.73 could be likely.
Technical Indicators
The 20 and 50-period moving averages are still in a bullish configuration, with the 20-period comfortably above the 50-period. At the same time though the Stochastic Oscillator has moved into an overbought area with the current value of 84.95.
Note, however, that markets can be overbought in terms of this indicator for extended periods during uptrends. Therefore price action-based GBPJPY analysis always trumps any indications given by oscillators and other technical indicators.
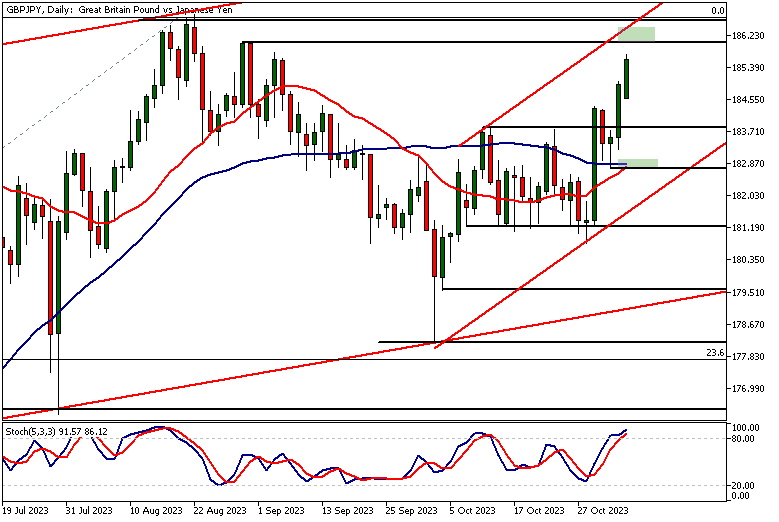
Daily GBPJPY Technical Analysis
The daily time frame chart shows GBPJPY breaking above a key resistance level we referred to in the weekly GBPJPY technical analysis above but it also shows the market trading inside a bullish trend channel.
Once again the Stochastic Oscillator is in the overbought zone but as the trend higher is strong the indication is less valid. The nearest confluence area can be found at 186.00 - 186.25 where a market structure level and the bull channel high coincide.
Strong Upside Momentum
The strong upside momentum in the GBJPY pair suggests that this area could be reached this week. However, if the market despite the recent strong upside momentum fails to attract buyers we could see a retracement back to 183.81 and then possibly to the nearest confluence level (182.73) below it.
This is where the SMAs and a market structure level coincide. GBJPY remains bullish above this confluence level. Below the level, we could see it trading down to 182.00.
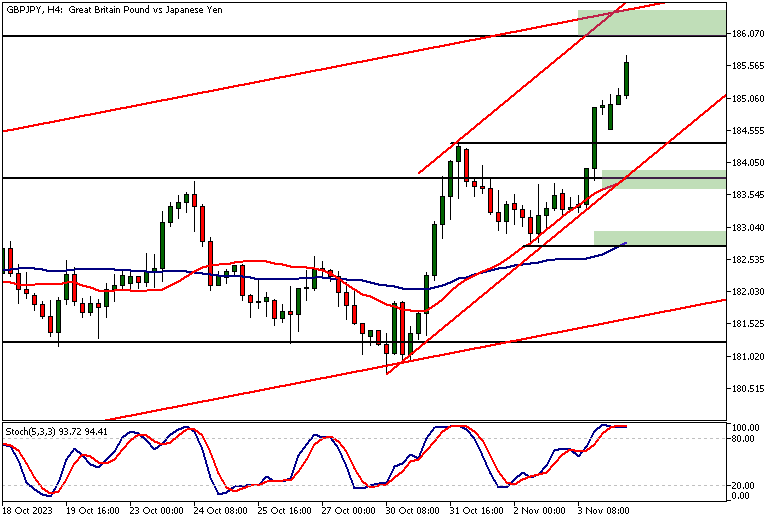
GBPJPY Technical Analysis, 4h Chart
The moving averages are pointing higher and the GBPJPY is creating higher lows as it trades higher in yet another bullish trend channel.
The channel low (currently at 183.33) coincides not only with the support level identified in the weekly GBPJPY analysis (183.81) but also with the SMA(20). The nearest support level however is at 184.35 while the nearest resistance area is at 186.00 - 186.45.
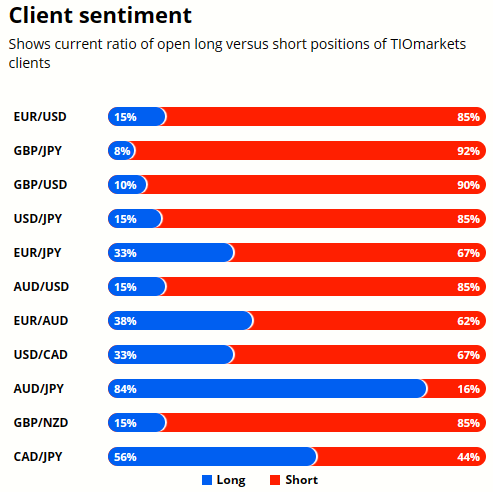
Client sentiment analysis
TIOmarkets' clientele are pronouncedly bearish on GBPJPY, with short positions making up 92%, leaving long positions in the minority at 8%.
Please remember that the retail trader client sentiment is a contrarian indicator as most of the retail traders are on average betting against the market trends. This is why, experienced traders tend to trade against the retail client sentiment. You can follow the TIOmarkets client sentiment live on our Forex dashboard.
The next key risk events impacting this market:
- BOE Gov Bailey's Speech
- Reuters Tankan Index
- BoJ Summary of Opinions
- UK GDP

Potential GBPJPY Market Moves
GBPJPY's break above key resistance and trading within a bullish channel suggest a continued rise, potentially reaching the confluence zone at 186.00 - 186.25. Strong momentum could maintain the trend uptrend.
Should GBPJPY fail to attract buyers, a retracement to daily support at 183.81 is possible. If this level fails, a further decline to the confluence support at 182.73 could occur.
How would you trade the GBPJPY today?
I hope this fundamental and technical GBPJPY analysis helps you to make better informed trading decisions. Check the latest market analysis for other instruments and subscribe to receive them in your inbox as soon as they are published
DISCLAIMER: TIO Markets offers an exclusively execution-only service. The views expressed are for information purposes only. None of the content provided constitutes any form of investment advice. The comments are made available purely for educational and marketing purposes and do NOT constitute advice or investment recommendation (and should not be considered as such) and do not in any way constitute an invitation to acquire any financial instrument or product. TIOmarkets and its affiliates and consultants are not liable for any damages that may be caused by individual comments or statements by TIOmarkets analysis and assumes no liability with respect to the completeness and correctness of the content presented. The investor is solely responsible for the risk of his/her investment decisions. The analyses and comments presented do not include any consideration of your personal investment objectives, financial circumstances, or needs. The content has not been prepared in accordance with any legal requirements for financial analysis and must, therefore, be viewed by the reader as marketing information. TIOmarkets prohibits duplication or publication without explicit approval.

Janne Muta holds an M.Sc in finance and has over 20 years experience in analysing and trading the financial markets.
Related Posts


Trade responsibly: CFDs are complex instruments and come with a high risk of losing all your invested capital due to leverage.