GBPUSD Technical Analysis | Bears are losing their grip?
BY Janne Muta
|November 1, 2023GBPUSD technical analysis - The Fed is not expected to hike rates today. Instead, the markets are betting the central bank will cut the rates by 25 bp in June 2024.
Traders will focus on the wording of the FOMC statement to get clues on whether these assumptions are still valid or whether the Open Market Committee has something new and unexpected to say in their statement. Hawkish statements would support the dollar and therefore pressure the GBPUSD pair.
The Bank of England (BoE) is also expected to keep the rates untouched as the bank believes inflation is easing. However, the services inflation has increased which could indicate the BoE is likely to keep the rates at elevated levels for longer.
Summary of This GBPUSD Technical Analysis Report:
- GBPUSD has declined 7.8% since July. Recent range-bound action hints at institutional buying. Market fluctuates between 1.2037 and 1.2337. Outcomes depend on breaking these ranges, influencing future trading directions.
- The daily GBPUSD chart displays lower swing highs, suggesting sellers might push the market to 1.2037. A break above 1.2200 could lead to 1.2288-1.2337, where multiple technical indicators align.
- The 4-hour GBPUSD chart mirrors the daily, showing higher swing lows since October 26th. A continuation might surpass 1.2200, but failure could lead the market back to 1.2096 or lower.
Read the full GBPUSD technical analysis report below.
GBPUSD technical analysis
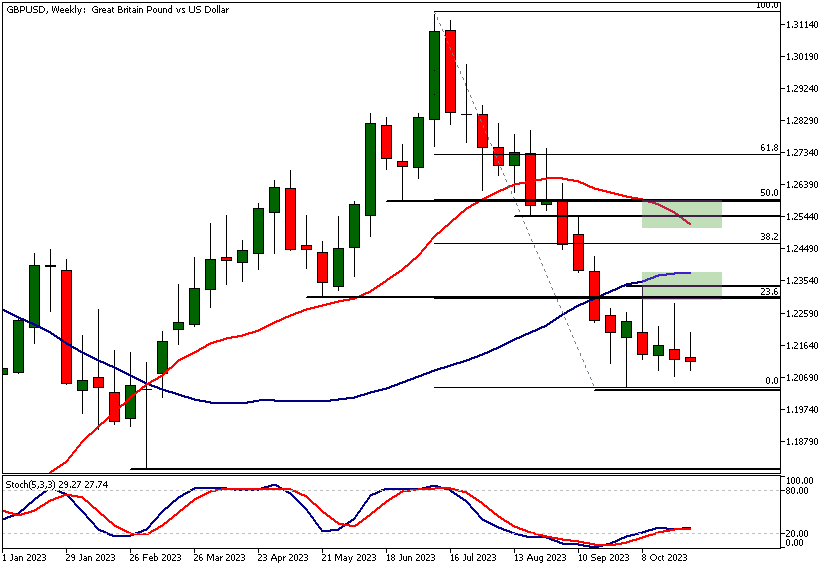
Weekly GBPUSD technical analysis
GBPUSD has lost over 7.8% since the July high. This down move has brought the market relatively close to the levels that started a substantial rally in March. The recent loss of downside momentum and the range-bound price action suggest that institutional buying has started to come in.
The market is range-bound between the 1.2037 support level and the 1.2337 resistance level. The loss of downside momentum is evident in the stochastic oscillator moving higher from a deeply oversold condition.
Potential Market Outcomes
If this sideways move is resolved to the upside, look for a move to the technical confluence area around the 20-period moving average and the 50% Fibonacci retracement level. Alternatively, if the market breaks the lower end of the range decisively, we could see it trading down towards the March low at 1.1802.

Daily GBPUSD technical analysis
The daily GBPUSD chart shows the market creating lower swing highs inside the range described in the weekly GBP/USD technical analysis section above. This indicates that sellers are willing to step in at lower and lower levels, possibly pushing the market to test the range low at 1.2037.
Technical Indicators
The stochastic oscillator is pointing to the upside, but we need to see a decisive break above the 1.2200. This would open the way for the market to possibly trade to 1.2288.
This is where we have a technical confluence area between 1.2288 and 1.2337. The 50-period moving average, the 23.6% Fibonacci retracement level, and a couple of market structure levels are closely aligned inside this range.
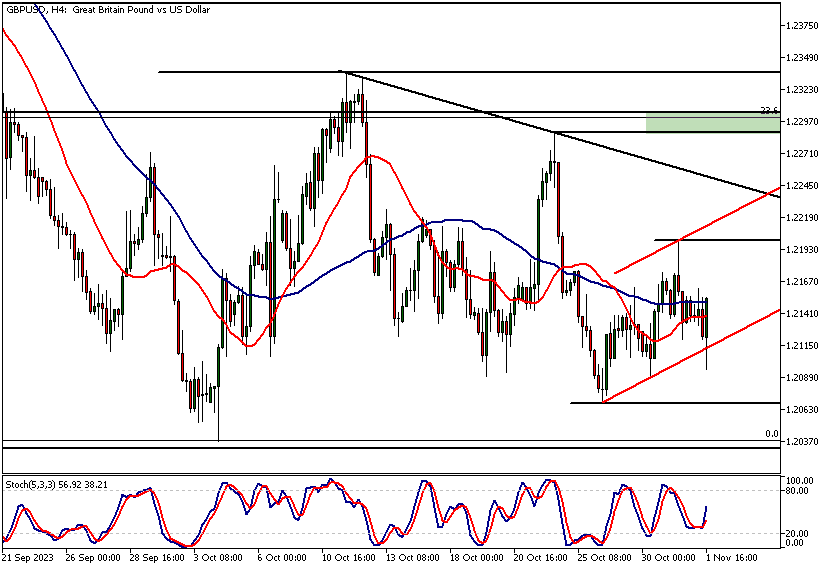
GBPUSD technical analysis, 4h chart
The 4-hour chart provides us with a picture fairly similar to the GBPUSD technical analysis based on the daily chart. The major support and resistance levels are roughly equal to those pointed out in the daily chart.
Market Trend Since October 26th
However, the 4-hour chart reveals that the market has created higher swing lows and higher highs since the October 26th low. If this continues, the market could likely break above the nearest key resistance level at 1.2200.
Alternatively, if the Sterling fails to rally beyond this point, the market would be more likely to move back to the 1.2096 low and then possibly below it.
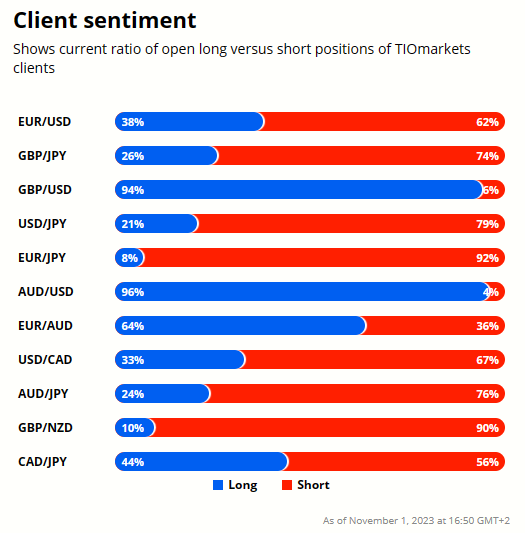
Client sentiment analysis
TIOmarkets' clients are very bullish on GBPUSD with 94% of them currently holding long positions in the DJ, while only 6% of them are short the market.
Please remember that the retail trader client sentiment is a contrarian indicator as most of the retail traders are on average betting against the market trends. This is why, experienced traders tend to trade against the retail client sentiment. You can follow the TIOmarkets client sentiment live on our Forex dashboard.
The key risk events impacting this market today:
- Federal Funds Rate
- FOMC Statement
- FOMC Press Conference
- BOE Monetary Policy Report
- BOE Monetary Policy Summary
- UK MPC Official Bank Rate Votes
- UK Official Bank Rate
- BOE Gov Bailey Speaks
- US Unemployment Claims
- US Average Hourly Earnings m/m
- US Non-Farm Employment Change
- US Unemployment Rate
- US ISM Services PMI

Potential GBPUSD Market Moves
The weekly GBPUSD technical analysis indicates, there's evidence less bearish movement in Sterling. If the market decisively breaks above the 1.2200 resistance, it could target the technical confluence area between 1.2288 and 1.2337, propelled by aligned technical indicators.
Conversely, the daily chart suggests possible bearish tendencies. If sellers continue stepping in at lower levels, the market might test and possibly breach the 1.2037 range low, indicating a downward trajectory for GBPUSD.
How would you trade the GBPUSD today?
I hope this fundamental and technical GBPUSD analysis helps you to make better informed trading decisions. Check the latest market analysis for other instruments and subscribe to receive them in your inbox as soon as they are published
DISCLAIMER: Tio Markets offers an exclusively execution-only service. The views expressed are for information purposes only. None of the content provided constitutes any form of investment advice. The comments are made available purely for educational and marketing purposes and do NOT constitute advice or investment recommendation (and should not be considered as such) and do not in any way constitute an invitation to acquire any financial instrument or product. TIOmarkets and its affiliates and consultants are not liable for any damages that may be caused by individual comments or statements by TIOmarkets analysis and assumes no liability with respect to the completeness and correctness of the content presented. The investor is solely responsible for the risk of his/her investment decisions. The analyses and comments presented do not include any consideration of your personal investment objectives, financial circumstances, or needs. The content has not been prepared in accordance with any legal requirements for financial analysis and must, therefore, be viewed by the reader as marketing information. TIOmarkets prohibits duplication or publication without explicit approval.
Join us on social media

Janne Muta holds an M.Sc in finance and has over 20 years experience in analysing and trading the financial markets.
Related Posts


Trade responsibly: CFDs are complex instruments and come with a high risk of losing all your invested capital due to leverage.