GBPUSD Technical Analysis | Bullish reversal candle in the daily chart
BY Janne Muta
|November 13, 2023GBPUSD Technical Analysis - This week UK reports on employment, wages, and CPI are closely watched by traders as the labour market is cooling with declining wage growth. October's CPI (out on Wednesday) is expected to show a significant decrease to 4.7% from 6.7%, potentially leading to the lowest inflation rate in two years.
Retail sales, (Friday) an important indicator of economic health is also expected come in much lower than below (-0.3% vs. 0.7% expected).
On the other side of the pond, recent US economic data, including retail sales and Consumer Price Index (CPI) figures (due tomorrow), suggest the Federal Reserve will have its work cut out when it comes to interest rate decision-making.
While the CPI indicates persistent inflation with a steady core rate, the expected decline in retail sales (scheduled for Wednesday) suggests that analysts are forecasting cooling consumer demand. This would, in turn, suggest that the environment of high interest rates coupled with high inflation is taking its toll on consumers.
Summary of This GBPUSD Technical Analysis Report:
- After the market broke out of a bearish trend channel at the beginning of October, it created a higher swing low at 1.2070 and has since created a base that is trying to break out.
- GBPUSD shows signs of reversal with potential upward momentum. A higher swing low above 1.2037 could lead to a rise towards 1.2590-1.2620, while falling below 1.2037 might see a decline to 1.1980.
- The 8-hour GBPUSD chart suggests potential for another higher swing low. Strength is indicated above 1.2187, targeting 1.2308 and possibly 1.2428, while below 1.2200, a move to 1.2096 is anticipated.
Read the full GBPUSD technical analysis report below.
GBPUSD technical analysis
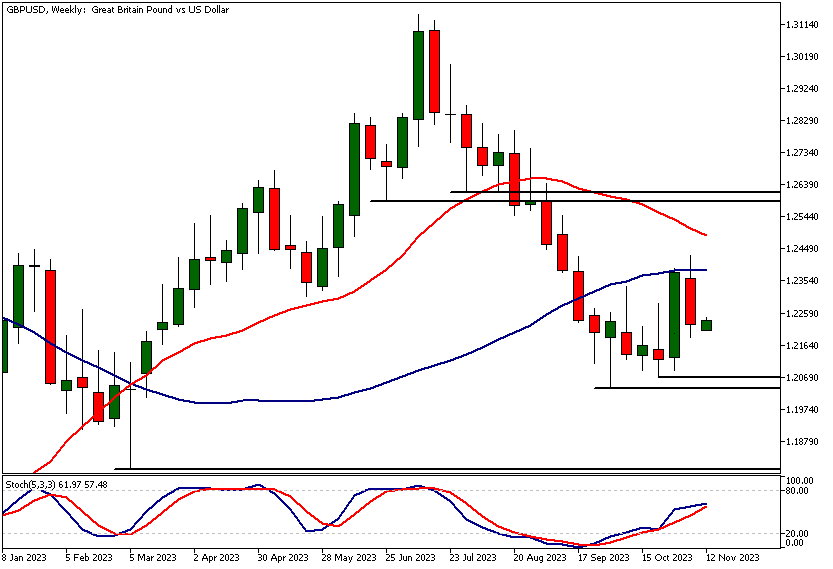
Weekly GBPUSD technical analysis
After the market broke out of a bearish trend channel at the beginning of October, it created a higher swing low at 1.2070 and has since created a base that is trying to break out.
Once the market created the higher swing low and started to recover, a strong rally emerged on 3rd November. Now, the market has retraced back to a key market structure level at 1.2200. It seems that the buyers are engaging the market again after the decline. Friday's candle indicates this.
Alternative scenarios
Our GBPUSD technical analysis suggests that the market could likely move higher from the 1.2200 support level. Above 1.2200, look for a move to the 1.2428 resistance level. Alternatively, if the market fails to attract buyers, we could see it trading down to 1.2070 again.
Indicator-based GBPUSD technical analysis suggests that the market is oversold at current levels, with the stochastic oscillator below the 20 level. The moving averages are converging, i.e., the 20-period fast moving average is moving closer to the 50 period SMA. This results from the market moving sideways and creating a base.
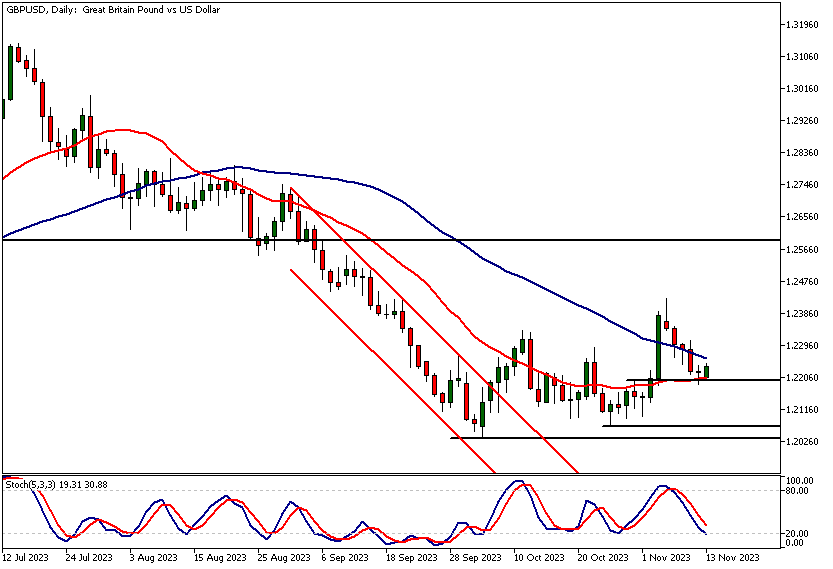
Daily GBPUSD technical analysis
GBP seems to be in a reversal process after the downward move was halted six weeks ago. The market has since created a base and bounced higher. Last week, GBPUSD retraced some of the earlier gains it made two weeks ago after a strong rally moved the market to the SMA(50).
Then profit-taking came in, and the bears pushed the market back down again. The stochastic oscillator is pointing higher, suggesting that upside momentum is recovering. If the market creates a higher swing low above 1.2037, we could see a move to the 1.2590 - 1.2620 range. Below 1.2037, look for a move to 1.1980.
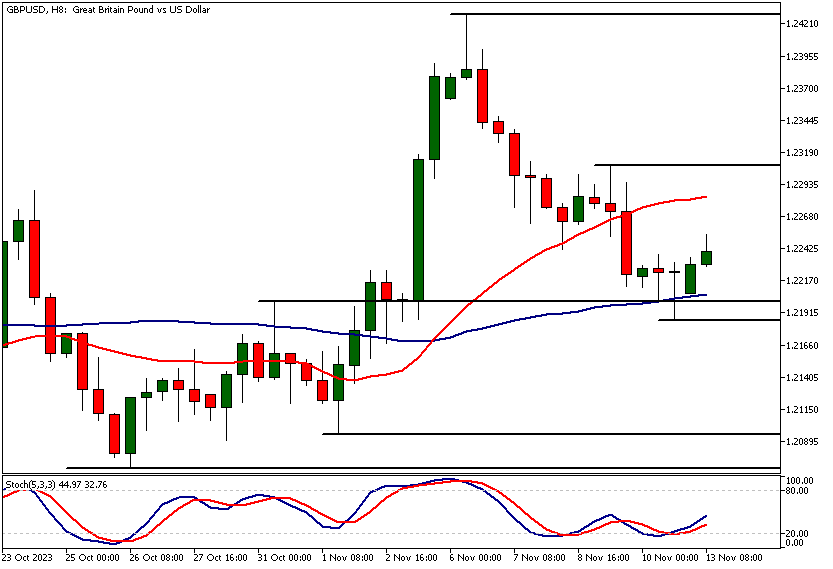
GBPUSD technical analysis, 8h chart
The 8-hour chart shows the market in the process of possibly creating another higher swing low. Over the last two candles, the market has been moving higher after an exhaustion candle was created at the key market structure level at 1.2200.
Potential target level
If this outside momentum can be sustained and the market shows further strength above 1.2187, the next 8-hour resistance level at 1.2308 could come into play. Should we see a decisive break above 1.2308, a move to 1.2428 could take place.
Below 1.2187, the next key support level on the 8-hour chart is the higher swing low in the daily chart at 1.2096. Look for a move to this level if there is a decisive break below 1.2187. Indicator-based GBPUSD technical analysis indicates strength in the market with the 20-period moving average above the SMA(50) and the stochastic oscillator moving higher from the oversold condition.
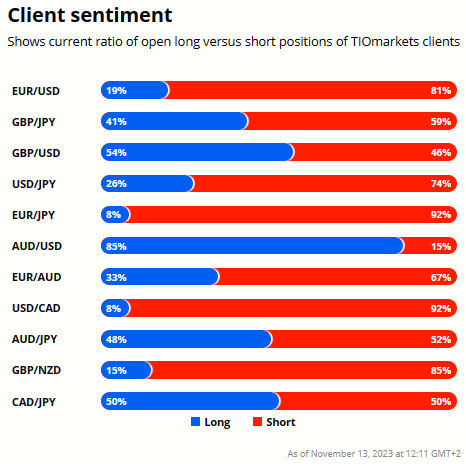
Client sentiment analysis
TIOmarkets' trader sentiment indicator shows that clients are not strongly committed to either direction in GBPUSD with 54% holding long positions and 46% shorting the market.
Please remember that the retail trader client sentiment is a contrarian indicator as most of the retail traders are on average betting against the market trends. This is why, experienced traders tend to trade against the retail client sentiment. You can follow the TIOmarkets client sentiment live on our Forex dashboard.
The key risk events impacting this market today:
- GBP-Claimant Count Change
- GBP-Average Earnings Index
- USD-Core CPI
- USD-CPI
- USD-CPI
- GBP-CPI
- USD-Core PPI
- USD-Core Retail Sales
- USD-Empire State Manufacturing Index
- USD-PPI
- USD-Retail Sales

Potential GBPUSD Market Moves
Our GBPUSD technical analysis suggests that the market could likely move higher from the 1.2200 support level. Above 1.2187, look for a move to the 1.2428 resistance level.
Alternatively, if the market fails to attract buyers, we could see it trading down to 1.2070 again if the 1.2187 level doesn't hold.
How would you trade the GBPUSD today?
I hope this fundamental and technical GBPUSD analysis helps you to make better informed trading decisions. Check the latest market analysis for other instruments and subscribe to receive them in your inbox as soon as they are published
DISCLAIMER: TIO Markets offers an exclusively execution-only service. The views expressed are for information purposes only. None of the content provided constitutes any form of investment advice. The comments are made available purely for educational and marketing purposes and do NOT constitute advice or investment recommendation (and should not be considered as such) and do not in any way constitute an invitation to acquire any financial instrument or product. TIOmarkets and its affiliates and consultants are not liable for any damages that may be caused by individual comments or statements by TIOmarkets analysis and assumes no liability with respect to the completeness and correctness of the content presented. The investor is solely responsible for the risk of his/her investment decisions. The analyses and comments presented do not include any consideration of your personal investment objectives, financial circumstances, or needs. The content has not been prepared in accordance with any legal requirements for financial analysis and must, therefore, be viewed by the reader as marketing information. TIOmarkets prohibits duplication or publication without explicit approval.

Janne Muta holds an M.Sc in finance and has over 20 years experience in analysing and trading the financial markets.
Related Posts


Trade responsibly: CFDs are complex instruments and come with a high risk of losing all your invested capital due to leverage.