GBPUSD Technical Analysis | Traders wait for Central Banks' Policy Clues
BY Janne Muta
|December 11, 2023GBPUSD Technical Analysis - The UK economy faces challenges with a struggling manufacturing sector while easing inflation has allowed the central bank to pause rate hikes. The Bank of England's decision to pause rate hikes suggests concerns about an economic slowdown.
The expectation of rate cuts in June 2024 indicates a shift towards a more accommodative monetary policy. The easing of inflation, albeit from high levels, is a positive development that could provide some relief to consumers and businesses.
However, the job market remains steady, and pay growth is relatively high. The overall outlook suggests the BoE is likely to remain cautious. This is reflected in the market expectations that the central bank is likely to leave the rates untouched in their meeting later in the week.
The next key data point from the US is the November inflation numbers (due tomorrow). In October 2023, US consumer prices remained stagnant, defying market expectations of a 0.1% increase, following a 0.4% rise in September.
Core consumer prices, excluding food and energy, grew by a lower-than-expected 0.2%, reflecting a broader economic slowdown. This suggests that the Federal Reserve's tightening measures are impacting the economy. Current expectations are 0.3% for Core CPI, 0% for Headline CPI, and 3.1% for Headline CPI.
On Wednesday, the FOMC press conference will be in focus as traders seek clues on when the central bank might start cutting rates. Currently, the first rate cut is expected to take place in May, with the terminal rate for the next year at 4%.
Summary of This GBPUSD Technical Analysis Report:
- GBPUSD gave a bearish signal last week by closing below the previous week's low. This increases downside risk in GBPUSD.
- Contrary to the weekly bearish signal the daily chart indicates that the uptrend could still be in force. If GBPUSD can establish either an equal or higher reactionary low above 1.2449, the uptrend indicated by moving average-based GBPUSD technical analysis should remain in force.
Read the full GBPUSD technical analysis report below.
GBPUSD technical analysis
Weekly GBPUSD technical analysis
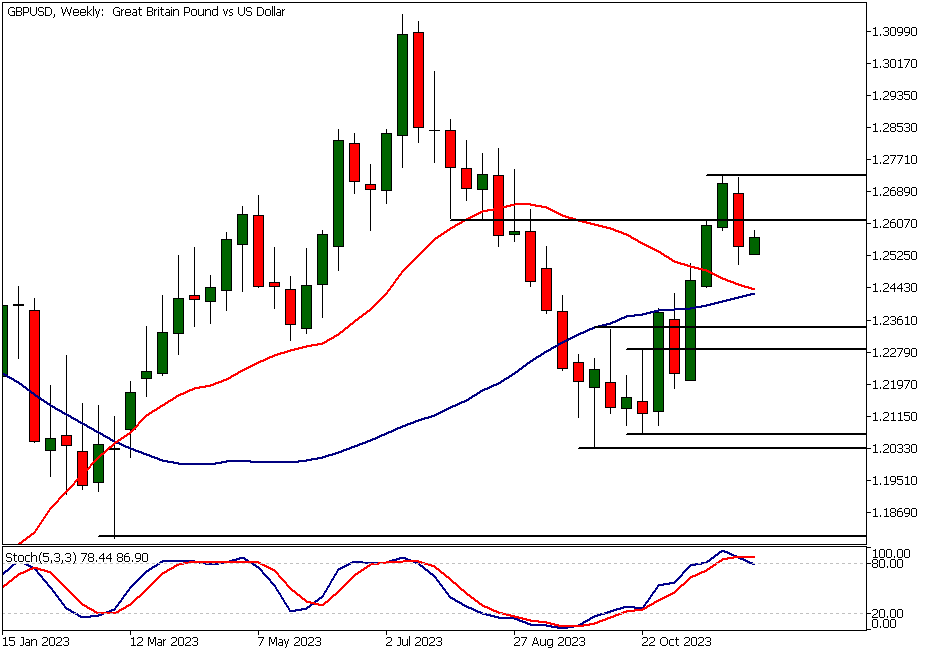
GBPUSD gave a bearish signal last week by closing below the previous week's low. This reversal signal could imply that the currency pair has more downside potential than upside potential over the next two weeks.
GBPUSD weakened after the USD index started moving higher two weeks ago. If this trend continues this week, we might see the currency pair trading within the 1.2445 - 1.2450 range. This price action-based GBPUSD technical analysis indication is supported by the stochastic oscillator providing a sell signal.
Alternatively, we could see the market moving towards 1.2735, which would entail a retest of the high from two weeks ago.
Daily GBPUSD technical analysis
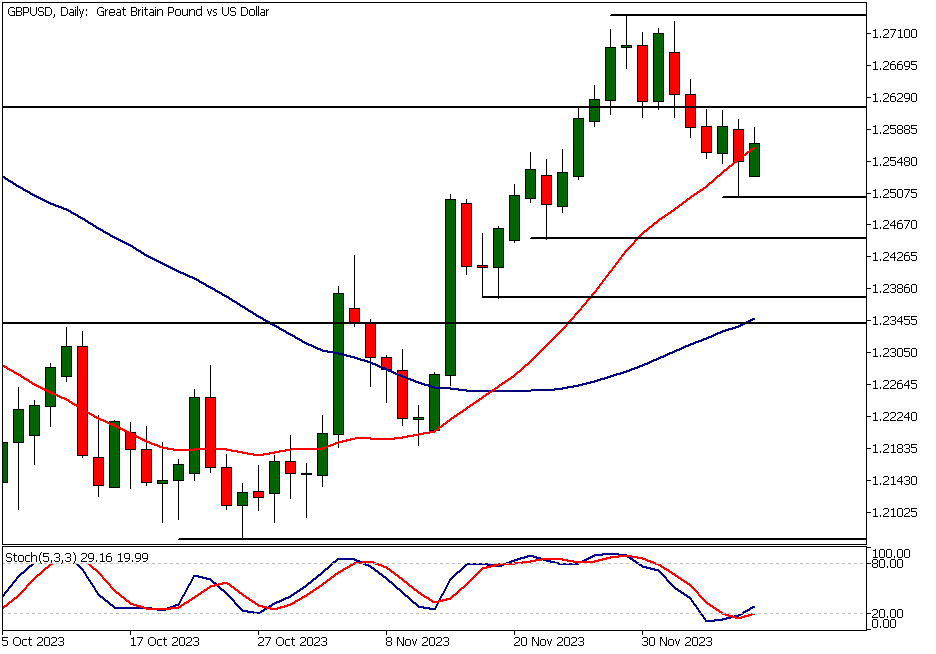
If GBPUSD can establish either an equal or higher reactionary low above 1.2449, the uptrend indicated by moving average-based GBPUSD technical analysis should remain in force. The 20-period moving average is above the 50-period SMA, and both moving averages are pointing higher. Also, note that the stochastic oscillator is starting to rise after indicating oversold conditions, about to give a buy signal.
The nearest daily time frame support levels are at 1.2474, 1.2449, and 1.2582, while the closest key resistance level is the high from two weeks ago at 1.2733. As the weekly time frame chart has just provided us with a bearish indication, the risk of further downward movement exists.
GBPUSD technical analysis, 8h chart
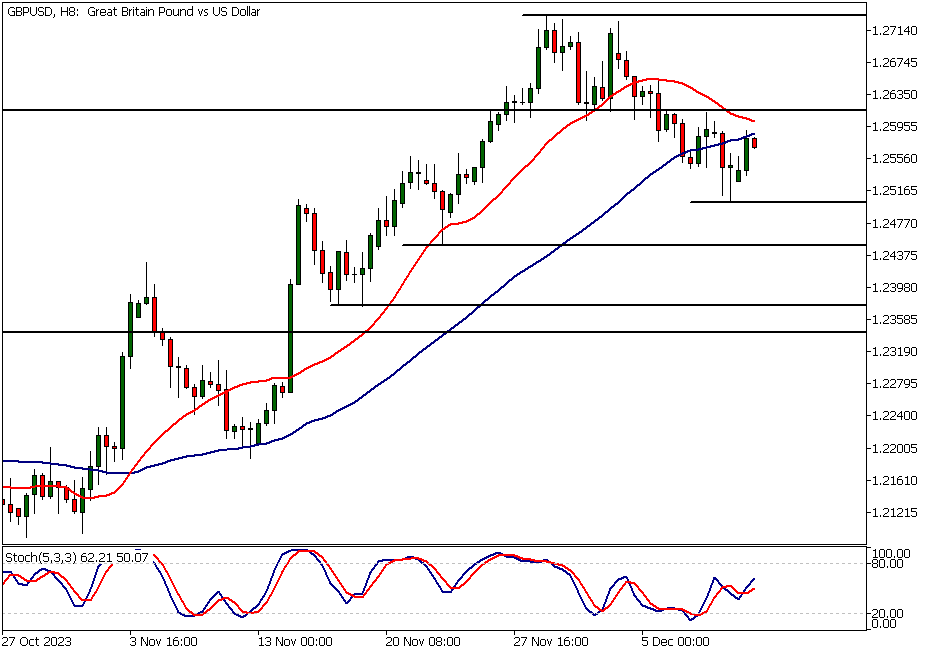
On the 8-hour chart, the market is trading below the 50-period moving average, and the 20-period SMA is pointing lower. Contrary to these bearish moving average indications, the market formed a bullish rejection candle in Friday's trading.
Should this early indication turn into further bullishness, we could see the market testing the market structure level at 1.2613. However, this is where the commitment of the bulls will be tested. GBPUSD technical analysis suggests that if they fail to take the market above this level, we should expect to see further downside in GBPUSD. Alternatively, should there be a decisive rally above this level, we could see the market trading towards 1.2660 or higher.
Client sentiment analysis
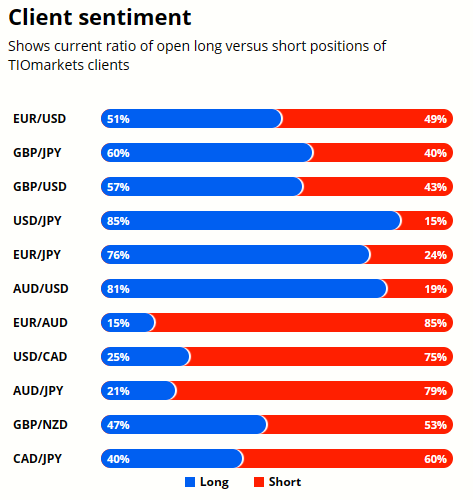
TIOmarkets' clients slightly bullish with 57% holding long positions and 43% holding short positions in GBPUSD.
Please remember that the retail trader client sentiment is a contrarian indicator as most of the retail traders are on average betting against the market trends. This is why, experienced traders tend to trade against the retail client sentiment. You can follow the TIOmarkets client sentiment live on our Forex dashboard.
The next key risk events impacting this market
- GBP - Claimant Count Change
- GBP - Average Earnings Index 3m/y
- USD - Core CPI
- USD - CPI
- GBP - GDP
- USD - PPI and Core PPI
- USD - Federal Funds Rate
- USD - FOMC Economic Projections
- USD - FOMC Statement
- USD - FOMC Press Conference
- GBP - Monetary Policy Summary
- GBP - MPC Official Bank Rate Votes
- GBP - Official Bank Rate
- USD - Retail Sales and Core Retail Sales
- USD - Unemployment Claims
- GBP - Flash Manufacturing PMI
- GBP - Flash Services PMI
- USD - Empire State Manufacturing Index
- USD - Industrial Production
- USD - Flash Manufacturing PMI
- USD - Flash Services PMI
Potential GBPUSD Market Moves
GBPUSD weakened after the USD index started moving higher two weeks ago. If this trend continues this week, we might see the currency pair trading within the 1.2445 - 1.2450 range. Alternatively, we could see the market moving towards 1.2735, which would entail a retest of the high from two weeks ago.

How would you trade the GBPUSD today?
I hope this GBPUSD technical analysis helps you to make better informed trading decisions. Check the latest market analysis for other instruments and subscribe to receive them in your inbox as soon as they are published
DISCLAIMER: TIO Markets offers an exclusively execution-only service. The views expressed are for information purposes only. None of the content provided constitutes any form of investment advice. The comments are made available purely for educational and marketing purposes and do NOT constitute advice or investment recommendation (and should not be considered as such) and do not in any way constitute an invitation to acquire any financial instrument or product. TIOmarkets and its affiliates and consultants are not liable for any damages that may be caused by individual comments or statements by TIOmarkets analysis and assumes no liability with respect to the completeness and correctness of the content presented. The investor is solely responsible for the risk of his/her investment decisions. The analyses and comments presented do not include any consideration of your personal investment objectives, financial circumstances, or needs. The content has not been prepared in accordance with any legal requirements for financial analysis and must, therefore, be viewed by the reader as marketing information. TIOmarkets prohibits duplication or publication without explicit approval.

Janne Muta holds an M.Sc in finance and has over 20 years experience in analysing and trading the financial markets.
Related Posts


Trade responsibly: CFDs are complex instruments and come with a high risk of losing all your invested capital due to leverage.