Gold Analysis | Key Price Levels For Trading
BY Janne Muta
|November 3, 2023Gold Analysis - The gold market has lost some momentum as the conflict between Israel and Hamas is anticipated to stay limited to Israel's territory. This is also reflected in the falling oil prices. Concurrently, support for the gold price is stemming from a rally in the U.S. bond market.
This surge lowered the yields, leading to a weaker USD overall, mitigating the decrease in gold demand as concerns about the Middle East conflict ease.
Earlier in the week, the Federal Reserve underscored the robustness of the U.S. economy, holding interest rates steady once again, contributing to lower yields and a softened dollar bids. The future macroeconomic data including today’s nonfarm payrolls report and the earnings data, will remain key factors in the Fed's decision making process.
Today's NFP report, along with the earnings data, is therefore critical for institutional investors as they adjust their portfolios to the Federal Reserve's interest rate path. Currently, the markets expect to see three rate cuts next year, starting from June.
The NFP report will indicate if the job market withstands the Fed's anti-inflation efforts. Surprisingly robust jobs and earnings could boost the dollar, while disappointing figures could bolster stocks and commodities.
Summary of This Gold Analysis Report:
- Gold's rally has paused after a 4% increase due to the Hamas-Israel conflict, with market sentiment less alarmed and technical indicators providing mixed signals for future price direction.
- In the daily chart, gold's uptrend persists with higher lows; a fast-moving average suggests continued buying interest. Key levels to watch are 1969 for potential gains and 1953 for significant support.
- The market shows a bullish triangle on the two-hour chart within an uptrend, signalling potential upside pressure. Sideways moving averages suggest caution though as traders await NFP data, influencing breakout direction.
Read the full Gold analysis report below.
Gold Analysis
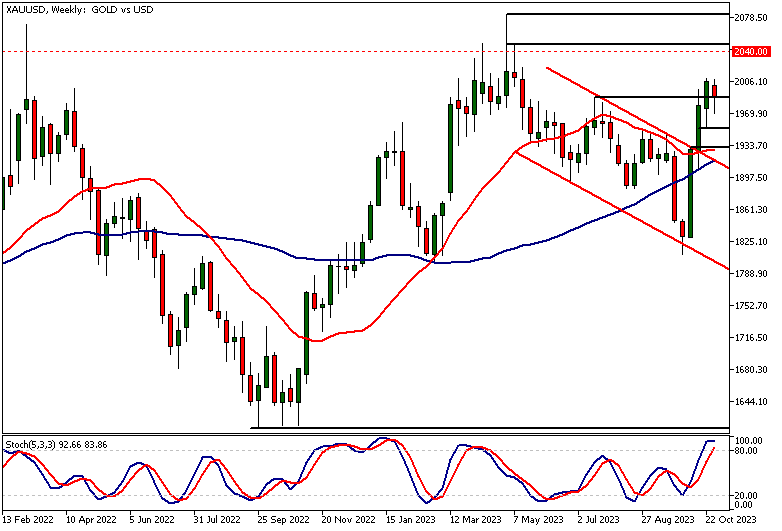
Weekly Gold Analysis
Gold has rallied approximately 4% since the bullish breakout from a descending price channel 3 weeks ago. The strong rally preceding the breakout was triggered by the Hamas-Israel war. This week, the market expectations have been less alarmist, with investors anticipating that even though the war is expected to last long, it is likely to remain within Israel's borders. The recent decline in the price of oil testifies to this effect.
Market's Expectation Impact
As a result, the price of gold has not been able to exceed last week's high and has corrected a little lower. However, at the time of writing, gold seems to be able to create another higher weekly low, suggesting that traders are still willing to buy the market. As per our gold analysis, this could result in trend continuation and could see the market targeting the 2040 level. This is a measured move target we talked about in our previous gold technical analysis report.
Mixed Technical Indicators
Gold technical analysis, in light of the indicators, gives a mixed message. While the 50-period moving average is still pointing to the upside, the 20-period moving average has contracted, and the stochastic oscillator is in the overbought area.
The nearest key support level is at 1953, while the nearest significant resistance level is at 2048. If the 1953 support level fails to attract buyers, look for a move down to the area where the moving averages are, 1916 - 1929.
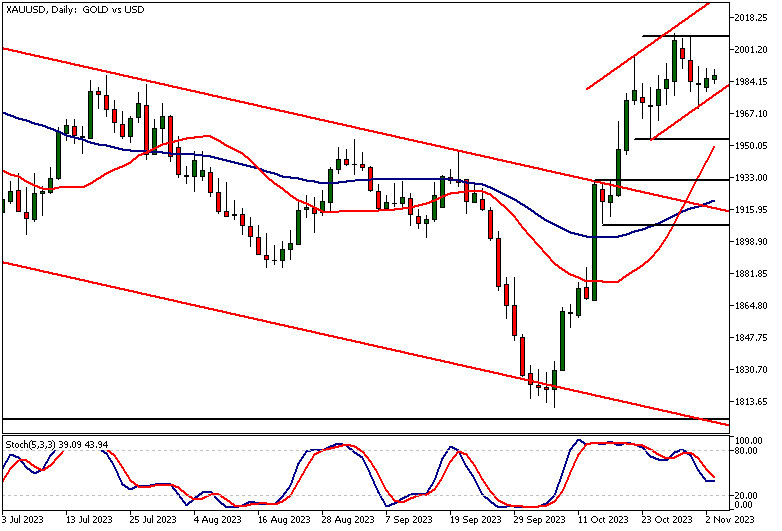
Daily Gold Analysis
The uptrend in the daily chart is still intact, with the market creating higher lows and the fast-moving average above the slow. The higher swing low at 1969 was followed by a daily candle with a higher low than the swing low.
Our gold analysis therefore indicates the gold bulls are still willing to buy the market at higher levels. Above the 1969 level, look for a move to 2008 or so. Alternatively, if the market fails to rally and breaks below 1969, we could see the gold market trading down to 1953. This level is closely aligned with the 20-period moving average, making it an important technical confluence level.

Gold Analysis, 2h Chart
The two-hour chart reveals a bullish triangle formation within the ascending trend channel. A decisive break above the upper end of the triangle formation at 1991 would open the way to 2008.
However, before the breakout has taken place, the market still remains vulnerable as shown by the lack of momentum in the moving averages. Both moving averages are moving sideways, indicating that strong buying pressure does not exist in the market at the moment.
This is probably explained by the fact that traders are waiting for the NFP data release. Our gold analysis indicates that if the market breaks the rising support created by the triangle formation, then we could see a move to the channel low, which currently is at 1974.
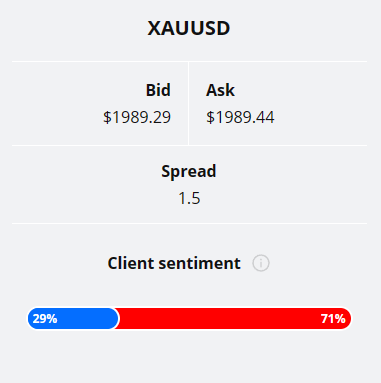
Client sentiment analysis
TIOmarkets' clients are bullish on Gold with 71% of them currently holding long positions in the market, while 29% of them are short the market.
Please remember that the retail trader client sentiment is a contrarian indicator as most of the retail traders are on average betting against the market trends. This is why, experienced traders tend to trade against the retail client sentiment. You can follow the TIOmarkets client sentiment live on our Forex dashboard.
The key risk events impacting this market today:
- US Average Hourly Earnings
- US Non-Farm Employment Change
- US Unemployment Rate
- US ISM Services PMI

Potential Gold Market Moves
The weekly and daily gold charts suggest bullish momentum, with prices forming higher lows and moving averages trending upward. A break above $1991 could see a swift move towards the $2008 resistance.
A bearish outlook emerges if gold breaks below the $1969 support, as indicated by the daily and 2-hour charts. This could lead to the market sliding down to $1953 or so.
How would you trade the Gold today?
I hope this fundamental and technical Gold analysis helps you to make better informed trading decisions. Check the latest market analysis for other instruments and subscribe to receive them in your inbox as soon as they are published
DISCLAIMER: TIO Markets offers an exclusively execution-only service. The views expressed are for information purposes only. None of the content provided constitutes any form of investment advice. The comments are made available purely for educational and marketing purposes and do NOT constitute advice or investment recommendation (and should not be considered as such) and do not in any way constitute an invitation to acquire any financial instrument or product. TIOmarkets and its affiliates and consultants are not liable for any damages that may be caused by individual comments or statements by TIOmarkets analysis and assumes no liability with respect to the completeness and correctness of the content presented. The investor is solely responsible for the risk of his/her investment decisions. The analyses and comments presented do not include any consideration of your personal investment objectives, financial circumstances, or needs. The content has not been prepared in accordance with any legal requirements for financial analysis and must, therefore, be viewed by the reader as marketing information. TIOmarkets prohibits duplication or publication without explicit approval.
Join us on social media

Janne Muta holds an M.Sc in finance and has over 20 years experience in analysing and trading the financial markets.
Related Posts


Trade responsibly: CFDs are complex instruments and come with a high risk of losing all your invested capital due to leverage.