Gold technical analysis | Can XAUUSD maintain current Price levels?
BY Janne Muta
|December 1, 2023Gold Technical Analysis - Dollar weakness, spurred by likely dovish shift in Fed policy, has bolstered gold prices. However, it's noteworthy that when gold has rallied to levels it is trading now at it has struggled to maintain upside momentum in the past. The latest rally marks the fourth instance since August 2020 that gold has reached the current high prices.
USD has been under pressure after a re-evaluation of monetary policy by the Federal Reserve was suggested by Governors Christopher Waller and Bowman. They advocated for a pause in interest rate hikes to support ongoing economic growth and high employment. This dovish stance, if adopted more broadly, suggests a departure from the aggressive rate hikes seen in the past year, aimed at curbing inflation.
The prospect of a softer approach to monetary policy, suggested by the Fed Funds Futures market, points to potential interest rate cuts in 2024. Such a move would mark a significant policy shift from the Federal Reserve, further contributing to dollar weakness. The market currently anticipates up to five rate reductions starting as early as May 2024, with a high probability of a rate cut in May.
Summary of This Gold Technical Analysis Report:
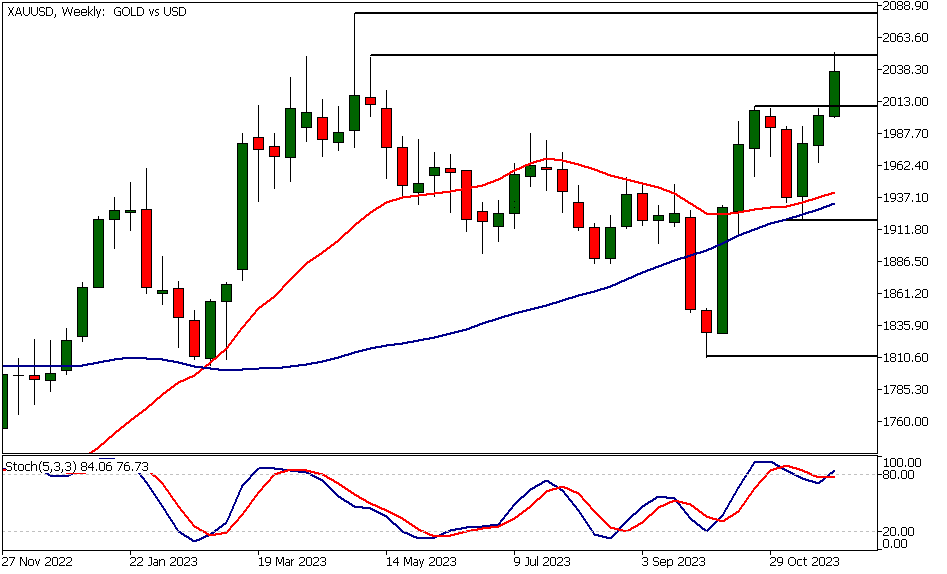
- The trend in the weekly time frame chart continues to rise, with gold rallying almost 7% since the market recovered from a two-week correction. However, the rally was interrupted this week as the market encountered resistance at 2048.16. The nearest key support level is at 2009.38, and the market remains bullish above this level.
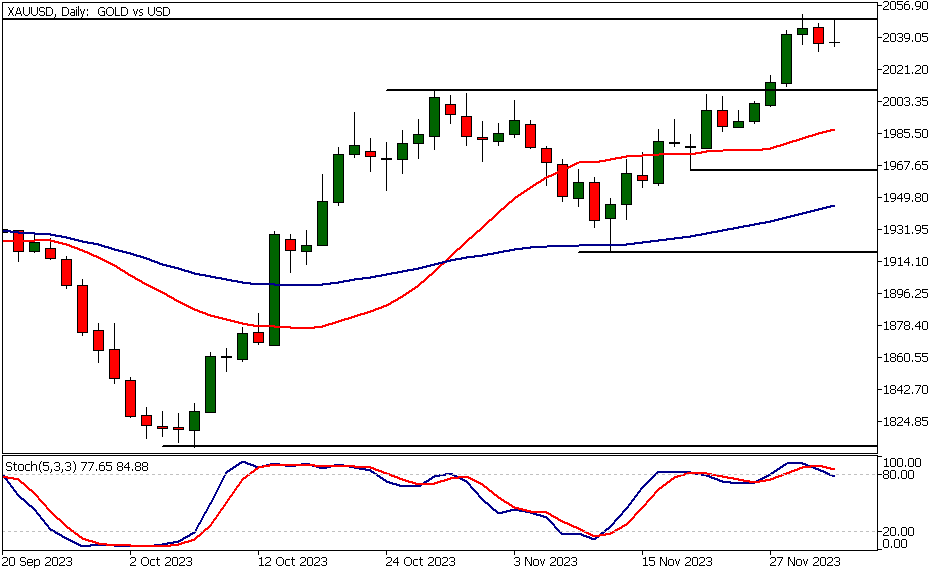
- The daily chart illustrates how the rally lost momentum at the 2048.16 resistance level. If there is a decisive break below 2031.33, we could see gold trading down to 2010. Alternatively, if the market can break above the 2048.16 resistance level and attract additional buying, gold could potentially reach 2075 or so.
Read the full gold technical analysis report below.
Gold Technical Analysis
Weekly Gold Technical Analysis
The trend in the weekly time frame chart continues to rise, with gold rallying almost 7% since the market recovered from a two-week correction. However, the rally was interrupted this week as the market encountered resistance at 2048.16. The nearest key support level is at 2009.38, and the market remains bullish above this level.
Our gold technical analysis suggests that should there be a significant retracement and the market trades decisively below 2009.38, we could see gold prices falling to around 1980. Indicator-based technical analysis suggests that the market remains bullish, as the fast 20-period moving average is positioned above the slower 50-period moving average, both pointing upwards.
Daily Gold Technical Analysis
The daily chart illustrates how the rally lost momentum at the 2048.16 resistance level. If there is a decisive break below 2031.33, we could see gold trading down to 2010.
Alternatively, if the market can break above the 2048.16 resistance level and attract additional buying, gold could potentially reach 2075 or so. According to indicator-based gold technical analysis, gold remains bullish also in the daily timeframe, with the 20-period moving average above the 50-period and both averages trending upwards.
Gold Technical Analysis, 8h
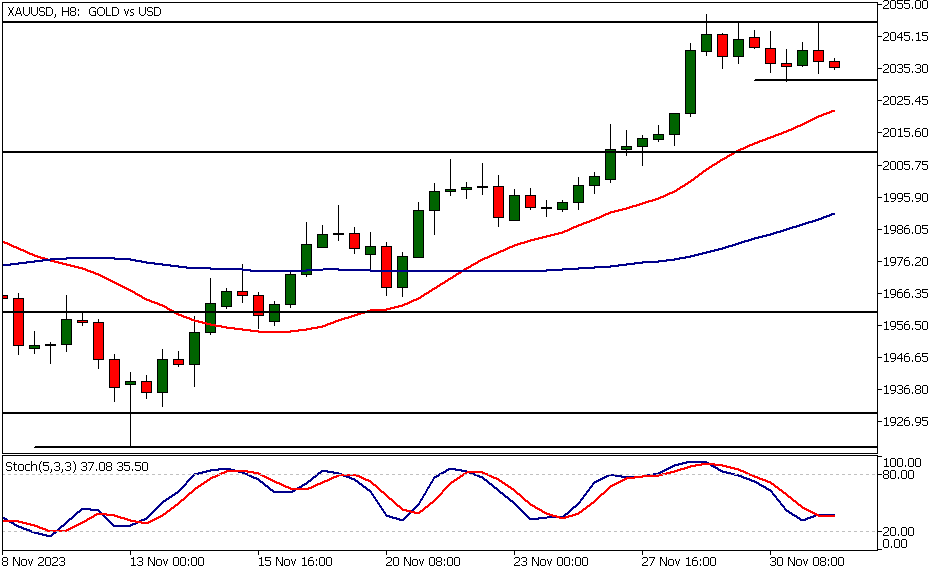
In the 8-hour chart, the price of gold has been fluctuating between 2031.33 and 2048.16. The most recent complete candle is a bearish rejection candle, suggesting that bulls faced considerable resistance near the 2048.16 level. If this leads to a decisive break below the 2031.33 support level, a move down to 2010 could follow.
Conversely, as mentioned in the daily gold technical analysis section above, a sustained rally above 2048.16 could pave the way to 2075. Again, the moving averages point higher, indicating that the overall bias in the gold market remains bullish.
The next key risk events impacting this market:
- USD - ISM Manufacturing PMI
- USD - ISM Manufacturing Prices
- USD - Fed Chair Powell Speaks
- USD - ISM Services PMI
- USD - JOLTS Job Openings
- USD - ADP Non-Farm Employment Change
- USD - Unemployment Claims
- USD - Average Hourly Earnings
- USD - Non-Farm Employment Change
- USD - Unemployment Rate
- USD - Prelim UoM Consumer Sentiment
- USD - Prelim UoM Inflation Expectations
Potential Gold Market Moves
The daily chart illustrates how the rally lost momentum at the 2048.16 resistance level. If there is a decisive break below 2031.33, we could see gold trading down to 2010.
Alternatively, if the market can break above the 2048.16 resistance level and attract additional buying, gold could potentially reach 2075 or so. According to indicator-based gold technical analysis, gold remains bullish also in the daily timeframe, with the 20-period moving average above the 50-period and both averages trending upwards.

How would you trade the Gold today?
I hope this Gold technical analysis helps you to make better informed trading decisions. Check the latest market analysis for other instruments and subscribe to receive them in your inbox as soon as they are published
DISCLAIMER: TIO Markets offers an exclusively execution-only service. The views expressed are for information purposes only. None of the content provided constitutes any form of investment advice. The comments are made available purely for educational and marketing purposes and do NOT constitute advice or investment recommendation (and should not be considered as such) and do not in any way constitute an invitation to acquire any financial instrument or product. TIOmarkets and its affiliates and consultants are not liable for any damages that may be caused by individual comments or statements by TIOmarkets analysis and assumes no liability with respect to the completeness and correctness of the content presented. The investor is solely responsible for the risk of his/her investment decisions. The analyses and comments presented do not include any consideration of your personal investment objectives, financial circumstances, or needs. The content has not been prepared in accordance with any legal requirements for financial analysis and must, therefore, be viewed by the reader as marketing information. TIOmarkets prohibits duplication or publication without explicit approval.

Janne Muta holds an M.Sc in finance and has over 20 years experience in analysing and trading the financial markets.
Related Posts


Trade responsibly: CFDs are complex instruments and come with a high risk of losing all your invested capital due to leverage.