Gold Technical Analysis | Gold hits a record high amid global tensions
BY Janne Muta
|December 4, 2023Gold Technical Analysis - Gold prices hit all-time highs near 2,150 due to renewed geopolitical tensions and Fed rate cut expectations. Geopolitical conflicts in Yemen, the ongoing Israel-Hamas strife, and a survey showing central banks' interest in increasing gold reserves have fueled this rally.
The news of attacks on commercial shipping in the Red Sea and A U.S. warship in the Red Sea shooting down three drones in response to distress calls from the commercial vessels was the likely reason for the price for the price of gold spiking higher.
Low liquidity conditions in the Asian session probably contributed to the rally, While three vessels came under attack in international waters, Yemen's Houthi group claimed responsibility for drone and missile strikes on two Israeli ships in the same region.
Additionally, a survey by the World Gold Council (WGC) revealed that nearly a quarter of central banks around the globe intend to increase their gold holdings in the next 12 months. This trend underscores a shift in confidence towards traditional reserve assets.
The trajectory of gold prices will continue to be influenced by factors such as the performance of the US Dollar, Federal Reserve policy expectations, and ongoing geopolitical events. Amidst these uncertainties, gold retains its status as a preferred safe-haven asset.
Summary of This Gold Technical Analysis Report:
- Gold surged to new all-time highs of $2,146 before giving back most of its gains, as it failed to attract additional demand above the April high of 2,081.82. If the market cannot surpass and sustain levels above this April high, a retracement back to 2,031 could occur.
- The daily time frame chart shows gold trading within an ascending trend channel. The nearest key support level in this time frame is at 2,031.33 while today's high at 2146.19 is the nearest dailytimeframe resistance level.
- On the 2-hour chart, gold retraced to the 20-period moving average before renewed buying began. The stochastic oscillator is in the oversold area, and if the current upward move continues, it could soon generate a buy signal. Indicator-based gold technical analysis suggests that the market is bullish with moving averates pointing higher.
Read the full gold technical analysis report below.
Gold Technical Analysis
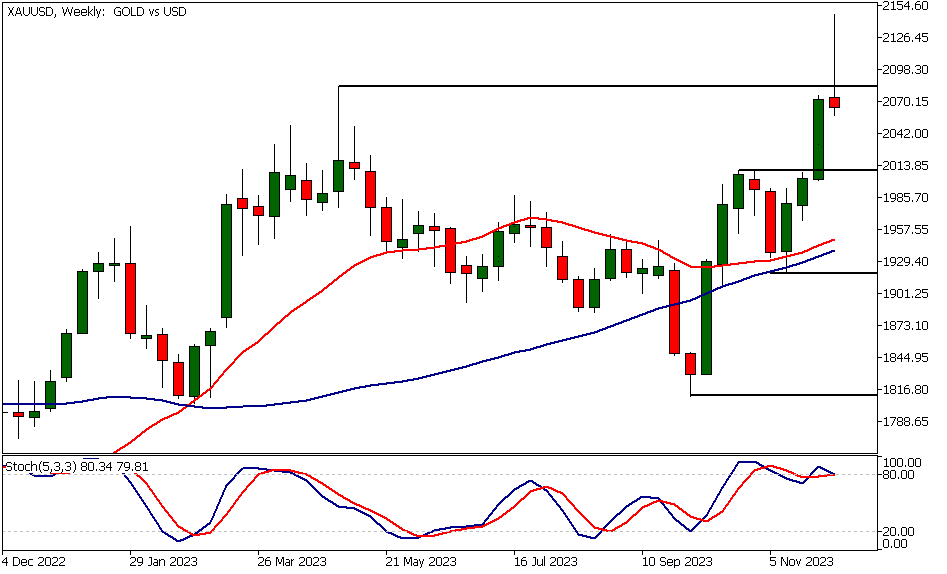
Weekly Gold Technical Analysis
Gold surged to new all-time highs of 2,146 before giving back most of its gains, as it failed to attract additional demand above the April high of 2,081.82. If the market cannot surpass and sustain levels above this April high, a retracement back to 2,031 could occur.
Our gold technical analysis suggests that if the market fails to attract buyers at 2031 level, the next key support level on the weekly chart at 2,009.38 could be tested. Conversely, if it remains above 2,031, the market might retest the 2,046.19 high.
Bullish weekly chart
The market remains bullish according to moving average and weekly chart pattern analysis. Notice how the moving averages are trending upward and a higher swing low has propelled gold's price in the strong rally observed over the past three weeks.
However, the market is currently relatively far (2.5%) from the nearest key weekly support level at 2,009.38. Therefore, there's a risk of the market retracting to this support level, especially if it fails to sustain the rally above the April high of 2,081.82. To gauge the likely direction of the gold market, we should follow price action analysis on daily and intraday time frame charts, which help us understand how momentum is developing intraday and at key price levels.
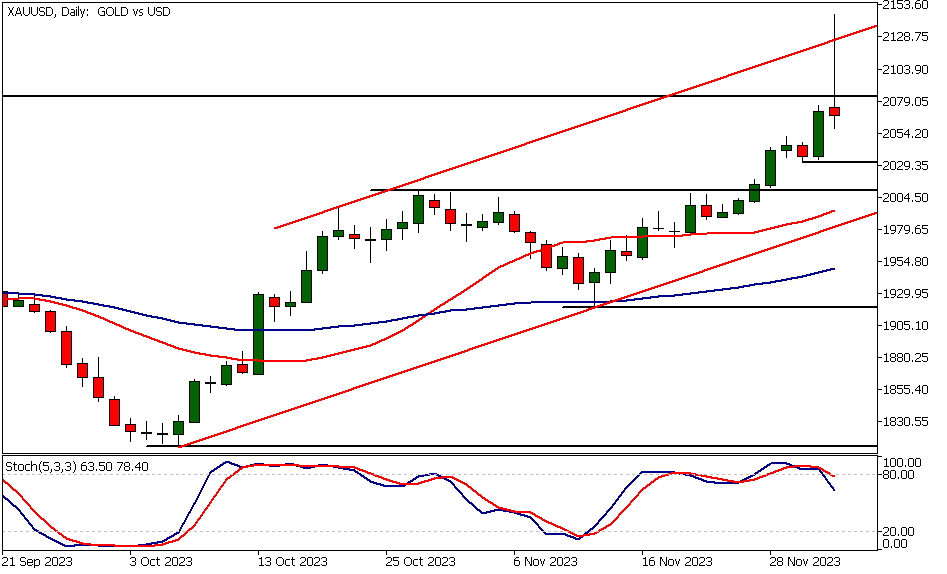
Daily Gold Technical Analysis
The daily time frame chart shows gold trading within an ascending trend channel. Mean reversion trading occurred as the market exceeded the channel high, driving the price of gold back below the April high. The nearest key support level in this time frame is at 2,031.33.
The market remains bullish above this level, and if there's a retracement back to it, traders might want to monitor intraday time frames for signs of renewed buying, which could signal further upside in gold prices. Alternatively, a break below 2,031.33 could push the market down to the 2,009 level again.
Moving averages point higher
According to indicator-based gold technical analysis the market remains bullish, as the 20-period moving average is above the 50-period SMA, and both are trending upward. The stochastic oscillator gives a warning though as it is declining from an overbought condition. The indicator is dragged down by the loss of momentum today.

Gold Technical Analysis, 2h
On the 2-hour chart, gold retraced to the 20-period moving average before renewed buying began. The stochastic oscillator is in the oversold area, and if the current upward move continues, it could soon generate a buy signal. Indicator-based gold technical analysis suggests that the market is bullish with moving averates pointing higher.
When moving averages trend higher, and the 20-period SMA is above the 50-period SMA, a stochastic oscillator moving into oversold territory can indicate a valid buying opportunity. However, traders should always complement these indicators with their own price action-based analysis.
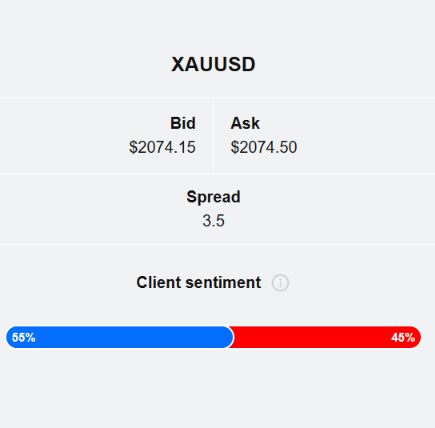
Client sentiment analysis
TIOmarkets client sentiment analysis doesn't provide clear indication on trader sentiment on Gold as clients are fairly evenly divided between bullish and bearish camps with 55% of clients holding long positions and 45% holding short positions in the market.
Please remember that the retail trader client sentiment is a contrarian indicator as most of the retail traders are on average betting against the market trends. This is why, experienced traders tend to trade against the retail client sentiment. You can follow the TIOmarkets client sentiment live on our Forex dashboard.
The next key risk events impacting this market:
- USD - ISM Services PMI
- USD - JOLTS Job Openings
- USD - ADP Non-Farm Employment Change
- USD - Unemployment Claims
- USD - Average Hourly Earnings
- USD - Non-Farm Employment Change
- USD - Unemployment Rate
- USD - Prelim UoM Consumer Sentiment
- USD - Prelim UoM Inflation Expectations
Potential Gold Market Moves
The daily time frame chart shows gold trading within an ascending trend channel. The nearest key support level in this time frame is at 2,031.33.
The market remains bullish above this level, and if there's a retracement back to it, traders might want to monitor intraday time frames for signs of renewed buying, which could signal further upside in gold prices. Alternatively, a break below 2,031.33 could push the market down to the 2,009 level again.

How would you trade the Gold today?
I hope this Gold technical analysis helps you to make better informed trading decisions. Check the latest market analysis for other instruments and subscribe to receive them in your inbox as soon as they are published
DISCLAIMER: TIO Markets offers an exclusively execution-only service. The views expressed are for information purposes only. None of the content provided constitutes any form of investment advice. The comments are made available purely for educational and marketing purposes and do NOT constitute advice or investment recommendation (and should not be considered as such) and do not in any way constitute an invitation to acquire any financial instrument or product. TIOmarkets and its affiliates and consultants are not liable for any damages that may be caused by individual comments or statements by TIOmarkets analysis and assumes no liability with respect to the completeness and correctness of the content presented. The investor is solely responsible for the risk of his/her investment decisions. The analyses and comments presented do not include any consideration of your personal investment objectives, financial circumstances, or needs. The content has not been prepared in accordance with any legal requirements for financial analysis and must, therefore, be viewed by the reader as marketing information. TIOmarkets prohibits duplication or publication without explicit approval.

Janne Muta holds an M.Sc in finance and has over 20 years experience in analysing and trading the financial markets.
Related Posts


Trade responsibly: CFDs are complex instruments and come with a high risk of losing all your invested capital due to leverage.