Gold technical analysis | Gold rallies amid expectations of Fed rate cuts
BY Janne Muta
|November 22, 2023Gold Technical Analysis - Gold prices have risen as bond yields have declined, driven by market anticipation that the Federal Reserve might halt interest rate hikes and lower them next year. This speculation has fuelled institutional bond purchases, with expectations that the Fed will reduce rates four times, beginning potentially in May 2024.
Current market trends, reflected in Fed Funds Futures, suggest a nearly 46.2% likelihood of rate cuts commencing in May. This shift towards expecting rate reductions has led to a significant influx of institutional investments into Treasury bonds, resulting in a prolonged decrease in yields.
Concurrently, there has been a notable decline in the value of the dollar, with the USD Index dropping from a high of 107.35 in October to 103.17 before recovering and moving higher today.
Summary of This Gold Technical Analysis Report:
- Gold continued to rally after successfully testing the high of the bear channel at 1919. In the process, gold has created a higher swing low at this level, where the 50-period moving average closely aligns with the channel top, adding technical significance to this level.
- The daily chart shows the market being somewhat apprehensive, now trading just below the October 27th swing high (2009). Today's daily high remains below yesterday's, with trading confined to a narrow range.
Read the full gold technical analysis report below.
Gold Technical Analysis
Weekly Gold Technical Analysis
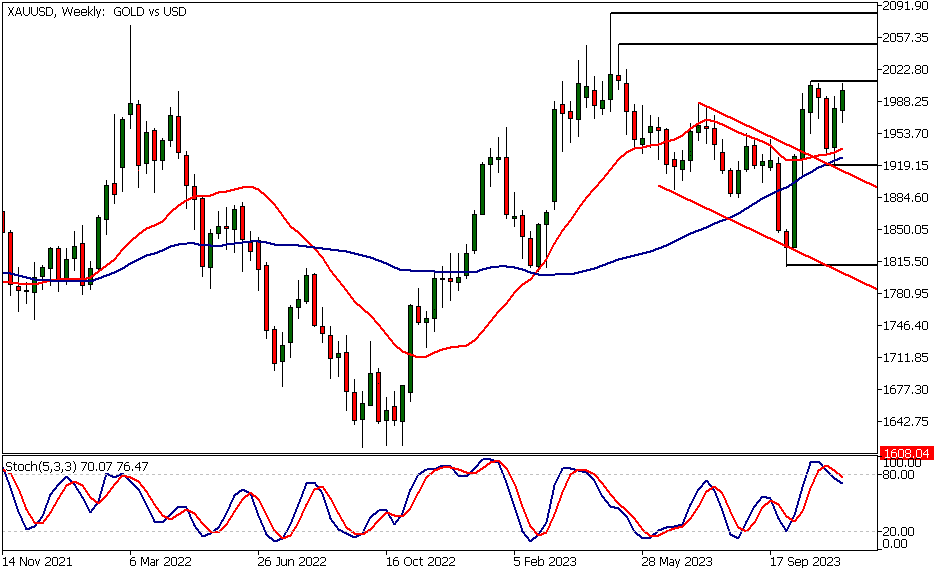
Gold continued to rally after successfully testing the high of the bear channel at 1919. In the process, gold has created a higher swing low at this level, where the 50-period moving average closely aligns with the channel top, adding technical significance to this level.
The strong rally from the October low, combined with the higher swing low at 1919, suggests that the market could push beyond the nearest weekly resistance level at 2009. If the market attracts additional buying above this level, we could see a move towards 2040 or so. However, falling below 1919, a move down to 1885 could be likely.
Indicator-based gold technical analysis aligns with the price action analysis, indicating that the market is bullish but is trading near the upper end of its recent price range. Both moving averages are pointing higher, with the 20-period moving average above the 50-period SMA. At the same time, the stochastic oscillator is still relatively close to the overbought threshold.
Daily Gold Technical Analysis
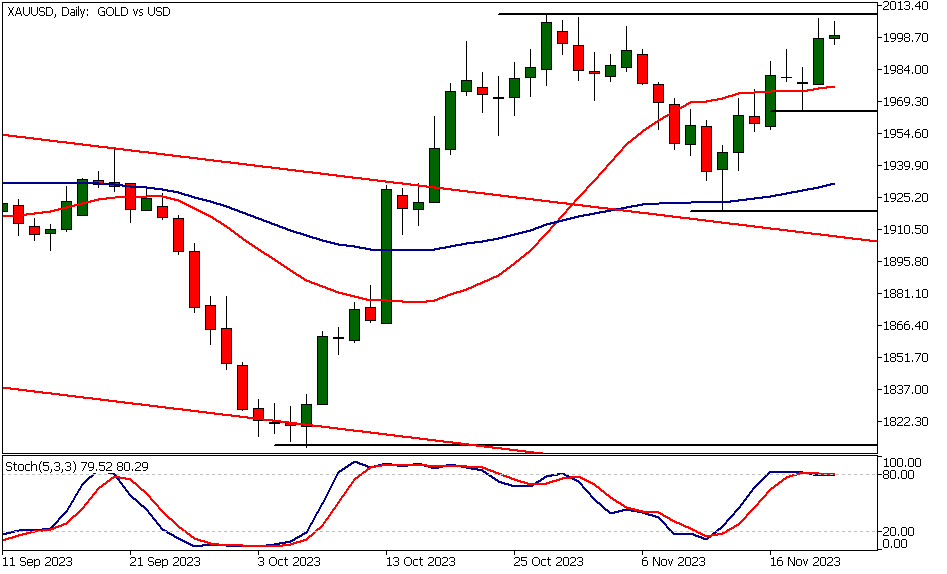
The daily chart shows the market being somewhat apprehensive, now trading just below the October 27th swing high (2009). Today's daily high remains below yesterday's, with trading confined to a narrow range.
Two days ago, the market created a higher swing low at 1965. Above this level, we could see the market pushing beyond 2009, while a decisive break below 1965 could move the market down to 1950.
Although gold can be described as trading within a range between 1919 and 2009, the higher swing low at 1965 suggests that the market is bullish and could move beyond the 2009 high.
Gold Technical Analysis, 8h
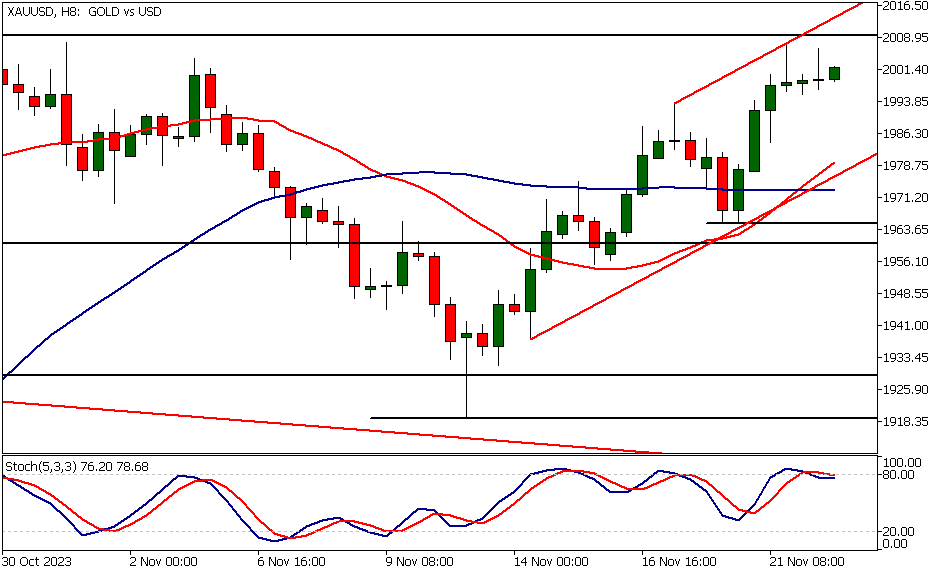
On the 8-hour chart, the market has created two bearish rejection candles near the 2009 resistance levels. This indicates that the market is weakening and could retrace some of its earlier upward movement. If this indication proves true, a move down to the bull channel low where the moving averages are could occur.
The 20-period SMA (currently at 1979) is closely aligned with the bull channel low. Therefore, if the market trades down and tests the channel low, we should monitor price action to see if the bulls are willing to buy against this technical support.
Gold technical analysis suggests that the market remains bullish above the 1965 support. Thus, the bulls might consider the rising trend channel low as a valid support. However, traders should look for price action confirmation before making any trading decisions.
Client sentiment analysis
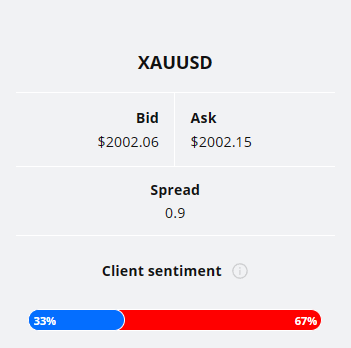
A majority of TIOmarkets' clients are bearish on gold, as 67% hold short positions while only 33% are optimistic with long positions.
Please remember that the retail trader client sentiment is a contrarian indicator as most of the retail traders are on average betting against the market trends. This is why, experienced traders tend to trade against the retail client sentiment. You can follow the TIOmarkets client sentiment live on our Forex dashboard.
The next key risk events impacting this market:
- USD - Flash Manufacturing PMI
- USD - Flash Services PMI
Potential Gold Market Moves
The strong rally from the October low, combined with the higher swing low at 1919, suggests that the market could push beyond the nearest weekly resistance level at 2009. If the market attracts additional buying above this level, we could see a move towards 2040 or so. However, falling below 1919, a move down to 1885 could be likely.

How would you trade the Gold today?
I hope this Gold technical analysis helps you to make better informed trading decisions. Check the latest market analysis for other instruments and subscribe to receive them in your inbox as soon as they are published
DISCLAIMER: TIO Markets offers an exclusively execution-only service. The views expressed are for information purposes only. None of the content provided constitutes any form of investment advice. The comments are made available purely for educational and marketing purposes and do NOT constitute advice or investment recommendation (and should not be considered as such) and do not in any way constitute an invitation to acquire any financial instrument or product. TIOmarkets and its affiliates and consultants are not liable for any damages that may be caused by individual comments or statements by TIOmarkets analysis and assumes no liability with respect to the completeness and correctness of the content presented. The investor is solely responsible for the risk of his/her investment decisions. The analyses and comments presented do not include any consideration of your personal investment objectives, financial circumstances, or needs. The content has not been prepared in accordance with any legal requirements for financial analysis and must, therefore, be viewed by the reader as marketing information. TIOmarkets prohibits duplication or publication without explicit approval.

Janne Muta holds an M.Sc in finance and has over 20 years experience in analysing and trading the financial markets.
Related Posts


Trade responsibly: CFDs are complex instruments and come with a high risk of losing all your invested capital due to leverage.