Gold Technical Analysis | Rising yields pressured gold
BY Janne Muta
|January 19, 2024Gold Technical Analysis - Gold traded lower earlier this week as strong US retail sales data strengthened the yields and the dollar. The drop was quickly reversed though as geopolitical tensions provided underlying support for the gold market. Fed rate cut expectations remain another driving force for the gold buys even though the markets might have overestimated how quickly the Fed is willing to cut the rates.
The Fed Funds futures market currently indicates a 55% probability for the first rate cut in March. For the year, traders expect to see six 25 bp rate cuts with the December target rate at 3.75%.
Earlier this week Fed Governor Christopher Waller emphasised a cautious approach to cutting U.S. interest rates, stating the need to ensure sustained low inflation before acting. Despite nearing the Federal Reserve's 2% inflation target,
Waller advocates for methodical rate reductions, balancing risks to maintain employment levels and control inflation. Recent data shows economic stability, but Waller insists on careful policy changes, requiring more data to confirm a sustainable inflation decrease.
Summary of This Gold Technical Analysis Report:
- If gold broke decisively above this week’s high and move to 2088 could be likely. Alternatively, look for a retest of 1973 support. Moving averages point higher but as long as the yields move higher it’s challenging for gold to stage a significant rally.
- Moving averages are still pointing higher suggesting a bullish medium-term trend in gold. Gold technical analysis however shows an ongoing correction. Gold is gradually trading lower in a bearish trend channel. The market is now approaching the channel high where the SMA20 is closely aligned with the channel top (currently at 2047.50).
- The 8h chart reveals another market structure level (2049) close to the descending trend channel top. Also, the SMA50 is relatively near the channel high. This confluence area could provide significant resistance to price advances as traders might take profits and make the market vulnerable to a downward correction. Indicator-based gold technical analysis suggests weakness with the SMA20 below the SMA50 and both moving averages pointing lower.
Read the full gold technical analysis report below.
Gold Technical Analysis
Weekly Gold Technical Analysis
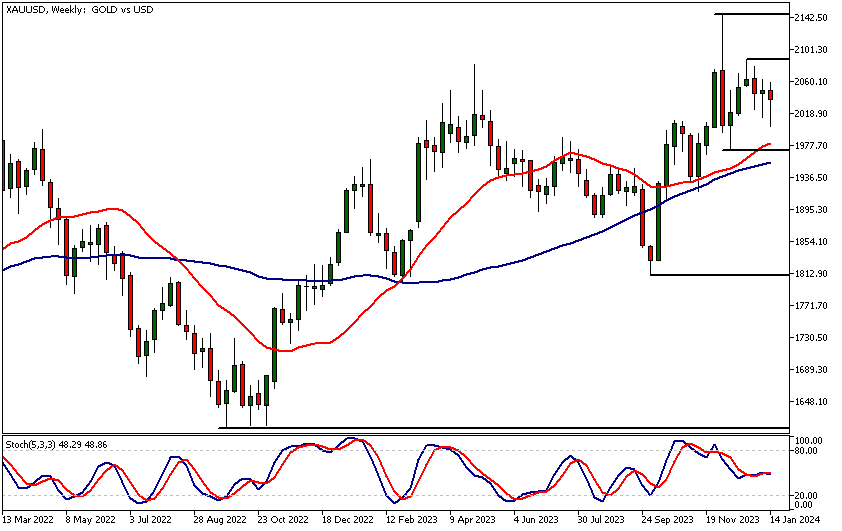
Gold continues to fluctuate indecisively looking for direction. The move below last week’s low was rejected and the market has recovered somewhat but the daily chart (see the daily gold technical analysis below) shows the market declining in a trend channel.
If gold broke decisively above this week’s high and move to 2088 could be likely. Alternatively, look for a retest of 1973 support. Moving averages point higher but as long as the yields move higher it’s challenging for gold to stage a significant rally.
Daily Gold Technical Analysis
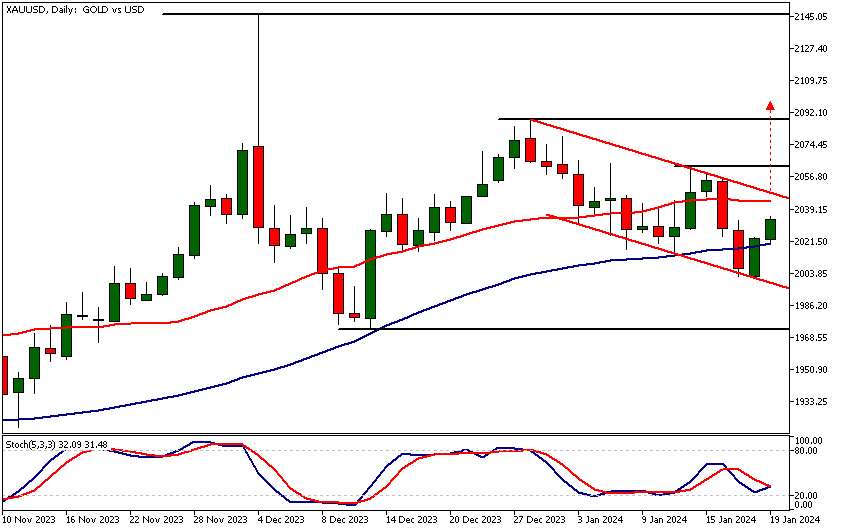
Moving averages are still pointing higher suggesting a bullish medium-term trend in gold. Gold technical analysis however shows an ongoing correction. Gold is gradually trading lower in a bearish trend channel. The market is now approaching the channel high where the SMA20 is closely aligned with the channel top (currently at 2047.50). I
f the market reverses below 2047.50 and continues the downtrend, traders could be targeting the most recent low (2002) in the short term and then possibly the 1973 low on extension. Alternatively, if the market breaks out of the trend channel the measured move target suggests a move to the 2088 high could be likely.
Intraday Gold Technical Analysis
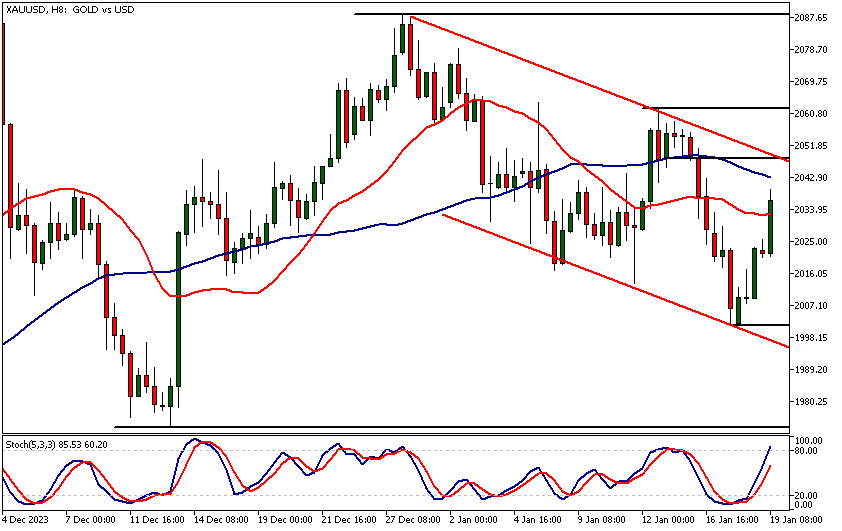
The 8h chart reveals another market structure level (2049) close to the descending trend channel top. Also, the SMA50 is relatively near the channel high.
This confluence area could provide significant resistance to price advances as traders might take profits and make the market vulnerable to a downward correction. Indicator-based gold technical analysis suggests weakness with the SMA20 below the SMA50 and both moving averages pointing lower.
The Stochastic oscillator is in the overbought zone but the market momentum is still strong so the price could be more likely to rally further today. The nearest support level is at 2002 and could come into play if the market remains in the bear channel.
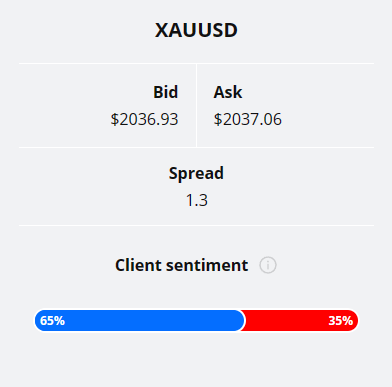
65% of clients trading USDJPY are holding long positions, while 35% are holding short positions. Client sentiment data is being provided by TIO Markets Ltd.
Please note that retail client trading sentiment is often said to be a contrarian indicator. This because trade data suggests that private (non-professional) traders, on average, trade against market price trends. You can follow the TIOmarkets client sentiment live on our Forex dashboard.
The next key risk events impacting this market:
- USD - Prelim UoM Consumer Sentiment
- USD - Existing Home Sales
- USD - Prelim UoM Inflation Expectations
- USD - Richmond Manufacturing Index
- USD - Flash Manufacturing PMI
- USD - Flash Services PMI
- USD - Advance GDP q/q
- USD - Unemployment Claims
- USD - Advance GDP Price Index q/q
- USD - Core Durable Goods Orders m/m
- USD - Durable Goods Orders m/m
- USD - New Home Sales
- USD - Core PCE Price Index m/m
- USD - Pending Home Sales m/m
Potential Gold Market Moves
If the market reverses below 2047.50 and continues the downtrend, traders could be targeting the most recent low (2002) in the short term and then possibly the 1973 low on extension. Alternatively, if the market breaks out of the trend channel the measured move target suggests a move to the 2088 high could be likely.

How Would You Trade Gold Today?
I hope this Gold technical analysis helps you to make better informed trading decisions. Check the latest market analysis for other instruments and subscribe to receive them in your inbox as soon as they are published
DISCLAIMER: TIO Markets offers an exclusively execution-only service. The views expressed are for information purposes only. None of the content provided constitutes any form of investment advice. The comments are made available purely for educational and marketing purposes and do NOT constitute advice or investment recommendation (and should not be considered as such) and do not in any way constitute an invitation to acquire any financial instrument or product. TIOmarkets and its affiliates and consultants are not liable for any damages that may be caused by individual comments or statements by TIOmarkets analysis and assumes no liability with respect to the completeness and correctness of the content presented. The investor is solely responsible for the risk of his/her investment decisions. The analyses and comments presented do not include any consideration of your personal investment objectives, financial circumstances, or needs. The content has not been prepared in accordance with any legal requirements for financial analysis and must, therefore, be viewed by the reader as marketing information. TIOmarkets prohibits duplication or publication without explicit approval.

Janne Muta holds an M.Sc in finance and has over 20 years experience in analysing and trading the financial markets.
Related Posts


Trade responsibly: CFDs are complex instruments and come with a high risk of losing all your invested capital due to leverage.