Gold technical analysis | Traders wait for Powell's speech
BY Janne Muta
|November 8, 2023Gold Technical Analysis - The price of gold is moving sideways ahead of Fed Chair Powell's speech. USD has been gaining ground pressuring gold over the last three days after the Minneapolis Fed President Neel Kashkari said more rate hikes are needed to bring inflation down.
Following his comments equities moved lower together with gold even though the 10 yr. bond yield hardly reacted at all. The rate cut expectations for the next year also remained unchanged at three cuts in June, July and November.
Summary of This Gold Technical Analysis Report:
- Gold is trading relatively close to a potential support area (1947 - 1953) on the weekly timeframe chart. A strong bounce higher from this support area could move the market to around 1983. Alternatively, should the market close below 1947 with follow-through selling, then a move to around 1910 could be possible.
- The daily chart shows how the market rejected the price levels near this key support level in yesterday's trading. However, to negate bearish signal given by the lower daily swing high at 2004 the market needs to rally decisively above the 1969 market structure level.
- The 4h chart shows the market trading sideways below the 1969.86 resistance level. The downside wicks suggest there is buying coming in to the market but so far the resistance level has been too much for the bulls to overcome.
Read the full gold technical analysis report below.
Gold Technical Analysis
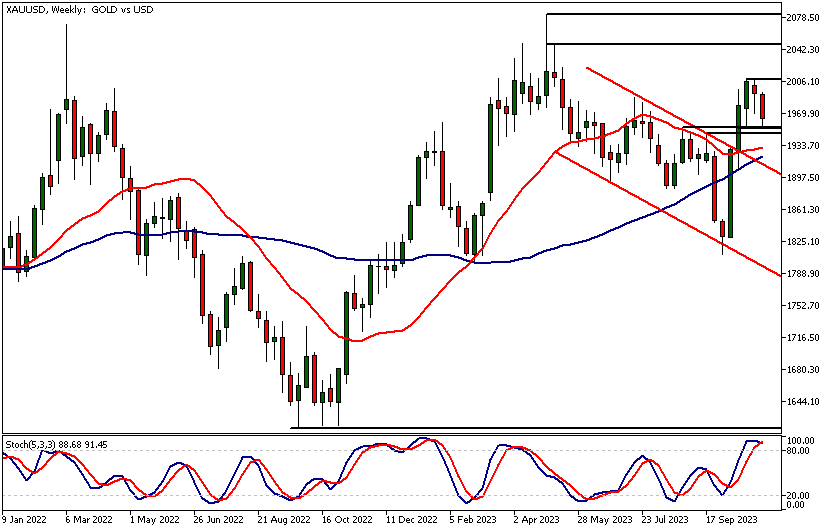
Weekly Gold Technical Analysis
Gold is trading relatively close to a potential support area (1947 - 1953) on the weekly timeframe chart. A strong bounce higher from this support area could move the market to around 1983. Alternatively, should the market close below 1947 with follow-through selling, then a move to around 1910 could be possible.
After rallying over 10%, gold has now retraced 2.3% or 46 dollars from the 2009.56 high. This retracement has brought the market relatively close to an important market structure level at 1953. This level stopped a rally and turned the market into a sizeable decline in August and has since acted as a support level two weeks ago.
Psychologically significant level
Therefore, our gold technical analysis indicates that it is possible the market reacts to this same psychologically significant price level again, providing either an intraday or a swing trade opportunity.
However, if the weekly candle closes below the previous week's low (1953.63), the probability of a trend continuation is much smaller. Also, the Stochastic Oscillator is in the overbought area and could soon give a sell signal. This is likely to happen if this week's candle closes near the range low and could signal further downside in gold.
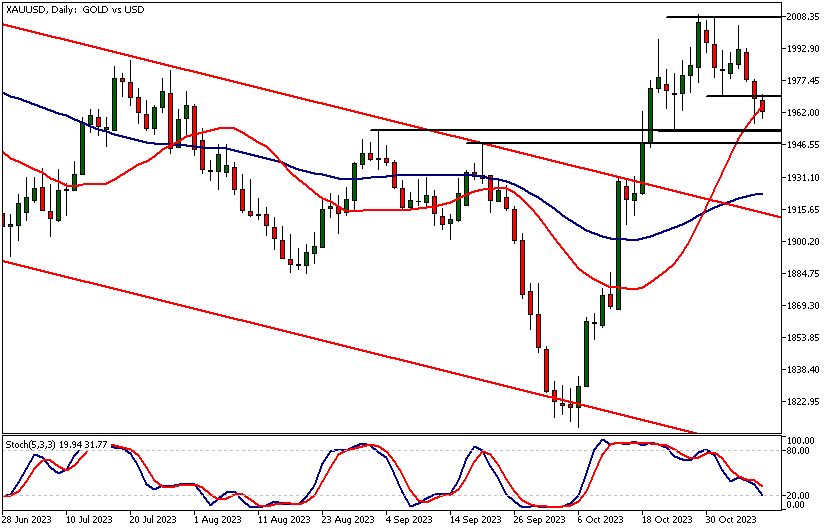
Daily Gold Technical Analysis
The daily chart shows how the market rejected the price levels near this key support level in yesterday's trading. This created a daily candle with a long wick, and if today’s candle creates a higher low the bullish signal from yesterday is confirmed by today’s price action.
However, to negate bearish signal given by the lower daily swing high at 2004 the market needs to rally decisively above the 1969 market structure level. If the 1969.86 level can't be penetrated decisively, we should look for a move down to the 1947 - 1953 price range.
Stochastic Oscillator near oversold levels
Indicator-based gold technical analysis suggests that the market isn't far from levels from which it could bounce higher. The 20-period moving average is above the 50-period SMA and points higher, while the stochastic oscillator is very close to the oversold area.
This combination of momentum strength in the moving average and the stochastic oscillator in the oversold area is a valid indication of bullishness when the price is trading near a key support level. However, as always, we only focus on price action itself when making trading decisions.
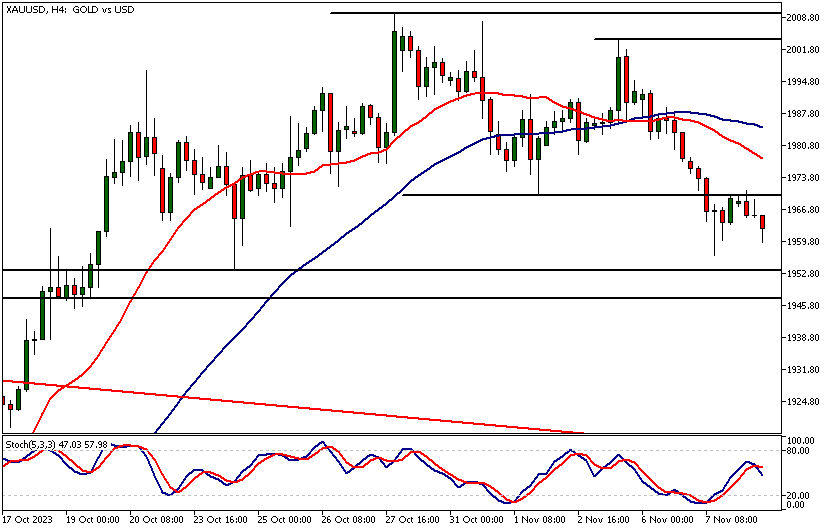
Gold Technical Analysis, 4h
The 4h chart shows the market trading sideways below the 1969.86 resistance level. The downside wicks suggest there is buying coming in to the market but so far the resistance level has been too much for the bulls to overcome.
A decisive rally above the level could move the market to levels near the 50 period SMA while continued weakness below the 1969.86 could push the market down to the 1947 – 1953 range.
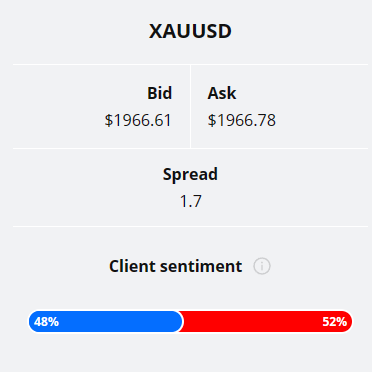
Client sentiment analysis
No strong indications from the TIOmarkets client sentiment as 48% of traders are long and 52% are short.
Please remember that the retail trader client sentiment is a contrarian indicator as most of the retail traders are on average betting against the market trends. This is why, experienced traders tend to trade against the retail client sentiment. You can follow the TIOmarkets client sentiment live on our Forex dashboard.
The next key risk events impacting this market:
- USD - Fed Chair Powell's Speech
- USD - Prelim UoM Consumer Sentiment
- USD - Prelim UoM Inflation Expectations
Potential Gold Market Moves
The market trades relatively close to an important market structure level at 1953. A strong move higher from this level could take gold to 1983.
If the weekly candle closes below the previous week's low (1953.63), the probability of a trend continuation is much smaller and below 1947 we could see a move down to 1910.

How would you trade the Gold today?
I hope this fundamental and technical Gold analysis helps you to make better informed trading decisions. Check the latest market analysis for other instruments and subscribe to receive them in your inbox as soon as they are published
DISCLAIMER: TIO Markets offers an exclusively execution-only service. The views expressed are for information purposes only. None of the content provided constitutes any form of investment advice. The comments are made available purely for educational and marketing purposes and do NOT constitute advice or investment recommendation (and should not be considered as such) and do not in any way constitute an invitation to acquire any financial instrument or product. TIOmarkets and its affiliates and consultants are not liable for any damages that may be caused by individual comments or statements by TIOmarkets analysis and assumes no liability with respect to the completeness and correctness of the content presented. The investor is solely responsible for the risk of his/her investment decisions. The analyses and comments presented do not include any consideration of your personal investment objectives, financial circumstances, or needs. The content has not been prepared in accordance with any legal requirements for financial analysis and must, therefore, be viewed by the reader as marketing information. TIOmarkets prohibits duplication or publication without explicit approval.

Janne Muta holds an M.Sc in finance and has over 20 years experience in analysing and trading the financial markets.
Related Posts


Trade responsibly: CFDs are complex instruments and come with a high risk of losing all your invested capital due to leverage.