Gold Technical Analysis | XAUUSD gains as USD softens on lower PCE expectation
BY Janne Muta
|November 28, 2023Gold Technical Analysis - The rally in gold is driven by market confidence that the Federal Reserve's rate increases will temper inflation in the U.S. economy without leading to a recession.
Markets expect to see the October Core PCE index coming in at 0.2%, 0.1% lower than in September. Moderate job additions and sector-specific retail resilience, coupled with easing core inflation and retreating energy costs, hint at modest m/m PCE growth despite a slight month-over-month drop in overall retail sales and a cooling economic landscape.
Market participants have been purchasing gold, as the Fed Funds Futures market suggests four rate cuts, indicating no anticipated shifts in Federal Reserve policy for 2024.
Traders in the Fed funds futures market are anticipating four rate reductions in 2024, beginning in June. For the Federal Reserve meeting on June 12, 2024, futures reflect a 72.8% likelihood of a rate decrease, with a 42.8% chance that this reduction will be by 25 basis points. This would lower the target rate from 5.25-5.50% to 5.00-5.25%.
Summary of This Gold Technical Analysis Report:
- After gold created a higher swing low at 1919, it is now moving above the 2009 resistance level, currently trading at 2015. The strong rally from October lows and the higher swing low suggest the market could be able to maintain the upside momentum.
- Yesterday, the market closed above the 2009 resistance level which might now serve as a support level. If gold prices defend the 2009 support level and continue trading above 2009, we could see the market reach 2040.
- The eight-hour chart shows the market trending higher within a bullish trend channel. The nearest support level on the 8-hour chart is at 1986. If the market continues creating higher lows above this level, it remains strongly bullish. Conversely, if the 1986 support level is breached, the gold market could test the 1965 support level.
Read the full gold technical analysis report below.
Gold Technical Analysis
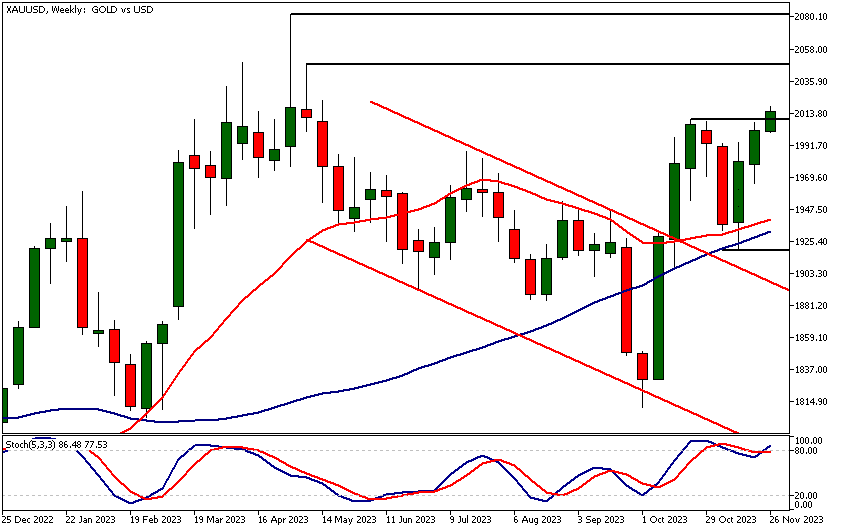
Weekly Gold Technical Analysis
After gold created a higher swing low at 1919, it is now moving above the 2009 resistance level, currently trading at 2015. The strong rally from October lows and the higher swing low suggest the market could be able to maintain the upside momentum. Traders might target levels near 2040.
However, if this attempt fails and the market moves below 2009, a retraction back to 1925 could occur. Our gold technical analysis indicates bullish market sentiment. Both moving averages (20 and 50 periods) are trending higher, with the market trading above both.
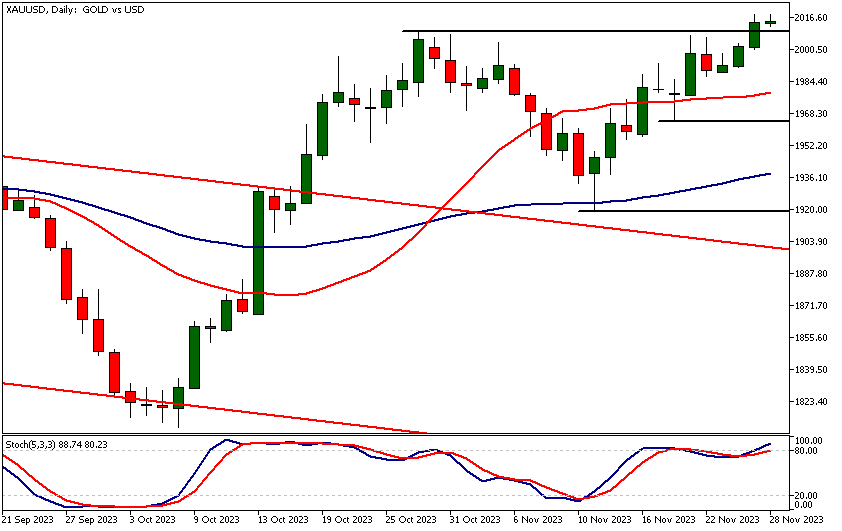
Daily Gold Technical Analysis
Yesterday, the market closed above the 2009 resistance level which might now serve as a support level. If gold prices defend the 2009 support level and continue trading above 2009, we could see the market reach 2040. The nearest support level below 2009 is at 1965. The market remains bullish above this level, while a decisive break below 1965 could lead to a drop towards 1925.
Gold technical analysis, supported by moving averages, suggests the market is bullish and likely to trade higher. The stochastic oscillator is in the overbought area, but this is common during uptrends, hence price action analysis should take precedence over oscillator readings.
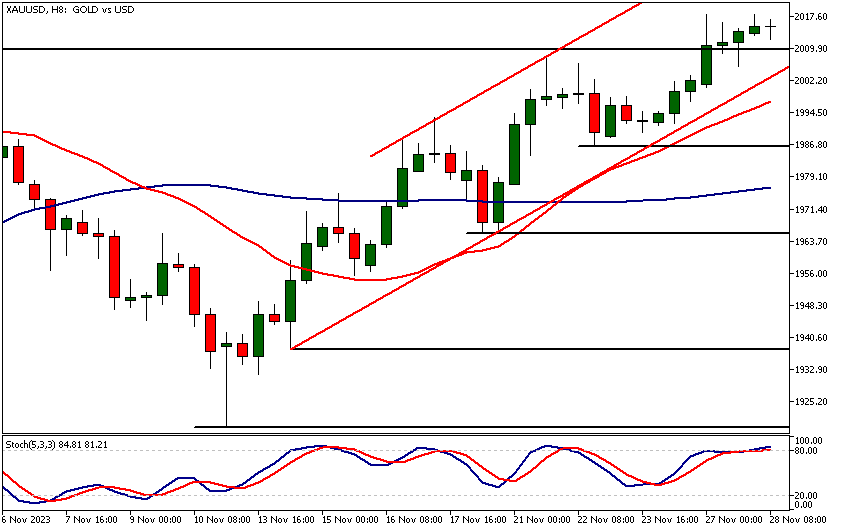
Gold Technical Analysis, 8h
The eight-hour chart shows the market trending higher within a bullish trend channel. The nearest support level on the eight-hour chart is at 1986. If the market continues creating higher lows above this level, it remains strongly bullish. Conversely, if the 1986 support level is breached, the gold market could test the 1965 support level.
Our eight-hour chart based gold technical analysis aligns with the technical picture in other timeframes, suggesting an upward trend in the market. Again, the stochastic oscillator is in the overbought area, but this bearish indication should be disregarded as long as price action contradicts it. Note that in uptrends, retracements in the indicator and subsequent buy signals are more valuable than the overbought indication.
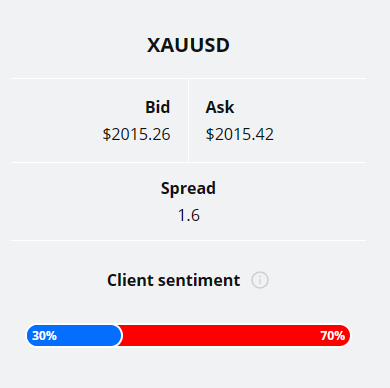
Client sentiment analysis
A majority of TIOmarkets' clients are bearish on gold, as 70% hold short positions while only 30% are optimistic about the gold market and hold long positions.
Please remember that the retail trader client sentiment is a contrarian indicator as most of the retail traders are on average betting against the market trends. This is why, experienced traders tend to trade against the retail client sentiment. You can follow the TIOmarkets client sentiment live on our Forex dashboard.
The next key risk events impacting this market:
- US S&P/CS Composite-20 HPI
- US CB Consumer Confidence
- US Richmond Manufacturing Index
- US FOMC Member Waller Speaks
- US Prelim GDP
- US Prelim GDP Price Index
- US Core PCE Price Index m/m
- US Unemployment Claims
- US Chicago PMI
- US Pending Home Sales
- US ISM Manufacturing PMI
- US ISM Manufacturing Prices
- US Fed Chair Powell Speaks
Potential Gold Market Moves
The nearest support level below 2009 is at 1965. The market remains bullish above this level, while a decisive break below 1965 could lead to a drop towards 1925.

How would you trade the Gold today?
I hope this Gold technical analysis helps you to make better informed trading decisions. Check the latest market analysis for other instruments and subscribe to receive them in your inbox as soon as they are published
DISCLAIMER: TIO Markets offers an exclusively execution-only service. The views expressed are for information purposes only. None of the content provided constitutes any form of investment advice. The comments are made available purely for educational and marketing purposes and do NOT constitute advice or investment recommendation (and should not be considered as such) and do not in any way constitute an invitation to acquire any financial instrument or product. TIOmarkets and its affiliates and consultants are not liable for any damages that may be caused by individual comments or statements by TIOmarkets analysis and assumes no liability with respect to the completeness and correctness of the content presented. The investor is solely responsible for the risk of his/her investment decisions. The analyses and comments presented do not include any consideration of your personal investment objectives, financial circumstances, or needs. The content has not been prepared in accordance with any legal requirements for financial analysis and must, therefore, be viewed by the reader as marketing information. TIOmarkets prohibits duplication or publication without explicit approval.

Janne Muta holds an M.Sc in finance and has over 20 years experience in analysing and trading the financial markets.
Related Posts


Trade responsibly: CFDs are complex instruments and come with a high risk of losing all your invested capital due to leverage.