Gold Technical Analysis | XAUUSD strengthens as Fed signals rate cuts
BY Janne Muta
|December 14, 2023Gold Technical Analysis - The Federal Reserve has maintained the federal funds rate at 5.25%-5.5% for the third consecutive meeting in December 2023, which is the highest in 22 years. Despite keeping the rates steady, the central bank indicated potential cuts in 2024, projecting three quarter percentage point reductions.
This projection is part of the "dot plot" forecasts, where eight officials anticipate fewer than three cuts next year, while five expect more. Contrary to the Fed's outlook, futures traders are expecting six rate cuts starting in May 2024, with an 88.9% probability of the first cut occurring then.
Following the Fed's decision bonds rallied pushing the yields and the dollar lower. The US Dollar Index dropped by almost 1%, weakened by the anticipation of rate cuts.
Market focus now shifts to US retail sales numbers as traders seek understand the likely future inflation trends. No major changes are expected in today's data release.
Summary of This Gold Technical Analysis Report:
- Gold moved sideways the day before yesterday as traders waited for the Fed rate decision. Then the promises of rate cuts for next year rallied the market strongly late in the US session yesterday. The upsurge moved the market to a key resistance level (2040) in the Asian session today.
- The rally took XAUUSD to the 2040 resistance level where the market has taken a breather. Now the bulls would need to show they have the needed resolve and buying power to move the market decisively above the 2040 resistance. If there is a rally above the level and gold is able to create a series of higher lows in minor timeframes the market could move higher to the 2070 - 2075 range.
- Alternatively, gold technical analysis suggests that if the rally fails a move down to 1998 could be likely. This is where the SMA(20) and SMA(50) are closely aligned with the bear channel top. Note also that a market structure level at 1996.68 is relatively close by.
Read the full gold technical analysis report below.
Gold Technical Analysis
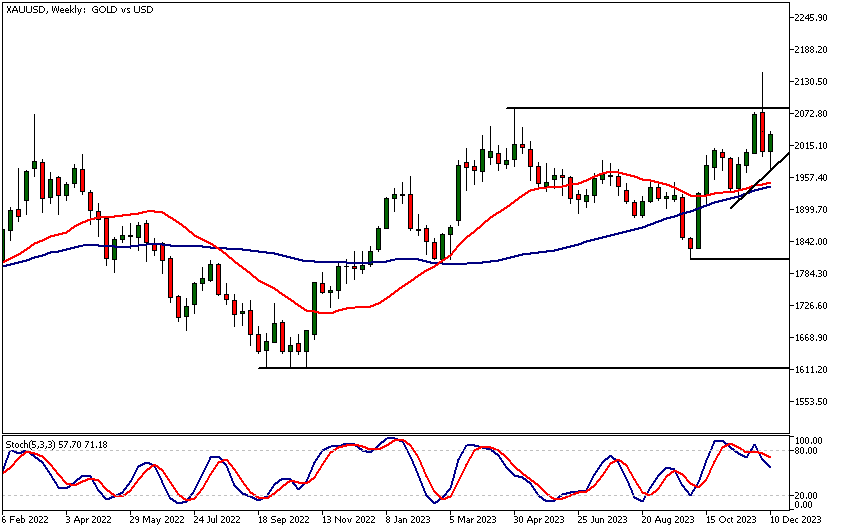
Weekly Gold Technical Analysis
Following the Fed-induced rally yesterday, gold now trades inside the range of the weekly rejection candle created last week as the market failed to attract new buying in the ATH levels. The moving averages are pointing higher with the SMA(20) slightly above the SMA(50) suggesting slight bullishness in the long run.
Note also that the rising trend line could encourage the gold bulls to look for trade opportunities on the long side as it suggests the bias could be to the upside.
However, it is also noteworthy that the market failed to maintain levels above the 2082 high created in April this year. Furthermore, the Stochastic Oscillator points lower indicating a loss of momentum.
Gold technical analysis indications in the weekly chart are therefore contradictory and traders should rely on multi-timeframe analysis which includes price action analysis in the intraday charts also.
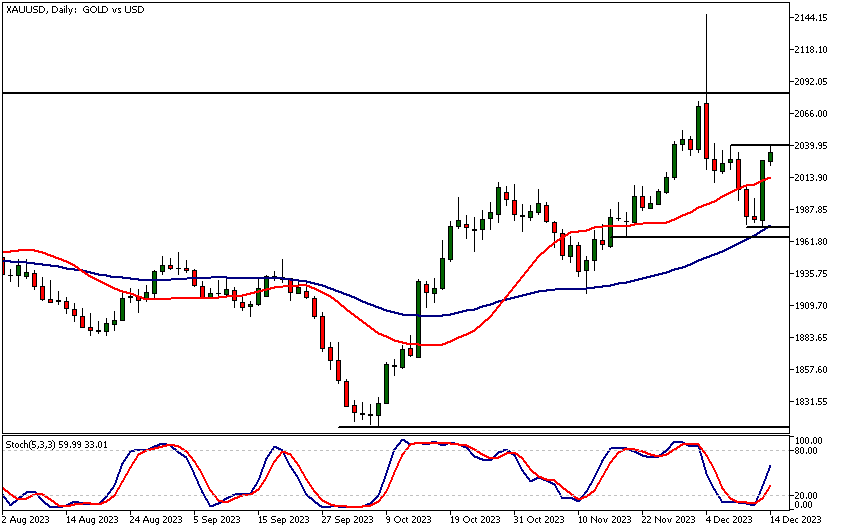
Daily Gold Technical Analysis
Gold moved sideways the day before yesterday as traders waited for the Fed rate decision. Then the promises of rate cuts for next year rallied the market strongly late in the US session yesterday. The upsurge moved the market to a key resistance level (2040) in the Asian session today.
The daily chart gives contracting technical signals with the moving averages suggesting higher prices (pointing higher and the fast SMA is above the slow SMA) while the bearish massive rejection candle created last week indicates the opposite.
Value of intraday price action analysis
Therefore, traders should follow price action in the intraday charts to see how the market reacts to minor support and resistance levels. Gold technical analysis in lower timeframe charts could help to gauge the likely market direction.
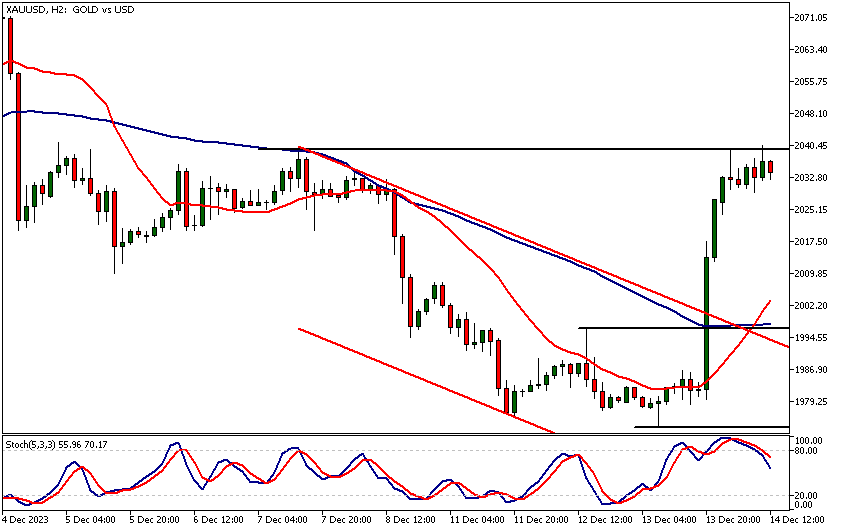
Intraday Gold Technical Analysis
The rally took XAUUSD to the 2040 resistance level where the market has taken a breather. Now the bulls would need to show they have the needed resolve and buying power to move the market decisively above the 2040 resistance.
If there is a rally above the level and gold is able to create a series of higher lows in minor timeframes the market could move higher to the 2070 - 2075 range.
Alternatively, gold technical analysis suggests that if the rally fails a move down to 1998 could be likely. This is where the SMA(20) and SMA(50) are closely aligned with the bear channel top. Note also that a market structure level at 1996.68 is relatively close by.
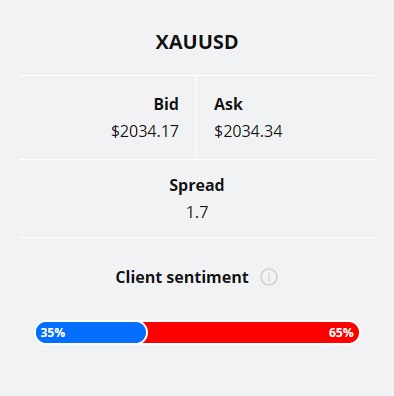
Client sentiment analysis
35% of clients trading XAUUSD are holding long positions, while 65% are holding short positions. Client sentiment data is being provided by TIO Markets Ltd.
It’s good to remember that retail client trading sentiment is a contrarian indicator as most retail traders are on average trading against market price trends. This is why experienced traders tend to trade against the retail client sentiment. You can follow the TIOmarkets client sentiment live on our Forex dashboard.
The next key risk events impacting this market:
- USD - Retail Sales and Core Retail Sales
- USD - Unemployment Claims
- USD - Empire State Manufacturing Index
- USD - Industrial Production
- USD - Flash Manufacturing PMI
- USD - Flash Services PMI
Potential Gold Market Moves
If gold rallies above the 2040 level and gold is able to create a series of higher lows in minor timeframes the market could move higher to the 2070 - 2075 range.
Alternatively, gold technical analysis suggests that if the rally fails a move down to 1998 could be likely. This is where the SMA(20) and SMA(50) are closely aligned with the bear channel top. Note also that a market structure level at 1996.68 is relatively close by.

How Would You Trade Gold Today?
I hope this Gold technical analysis helps you to make better informed trading decisions. Check the latest market analysis for other instruments and subscribe to receive them in your inbox as soon as they are published
DISCLAIMER: TIO Markets offers an exclusively execution-only service. The views expressed are for information purposes only. None of the content provided constitutes any form of investment advice. The comments are made available purely for educational and marketing purposes and do NOT constitute advice or investment recommendation (and should not be considered as such) and do not in any way constitute an invitation to acquire any financial instrument or product. TIOmarkets and its affiliates and consultants are not liable for any damages that may be caused by individual comments or statements by TIOmarkets analysis and assumes no liability with respect to the completeness and correctness of the content presented. The investor is solely responsible for the risk of his/her investment decisions. The analyses and comments presented do not include any consideration of your personal investment objectives, financial circumstances, or needs. The content has not been prepared in accordance with any legal requirements for financial analysis and must, therefore, be viewed by the reader as marketing information. TIOmarkets prohibits duplication or publication without explicit approval.
Join us on social media

Janne Muta holds an M.Sc in finance and has over 20 years experience in analysing and trading the financial markets.
Related Posts


Trade responsibly: CFDs are complex instruments and come with a high risk of losing all your invested capital due to leverage.