


How to Use DXY to Trade Forex: The Complete US Dollar Index Trading Guide
BY Maria K.
|July 24, 2026The US Dollar Index (DXY) provides forex traders with a comprehensive view of USD strength that individual currency pairs cannot offer alone. Understanding how to use DXY to trade forex involves analyzing this benchmark indicator to
- confirm trade direction;
- identify potential reversals;
- and filter high-probability setups across multiple USD-correlated pairs.
This DXY trading guide covers the fundamentals of US Dollar Index trading, explains DXY correlations with major forex pairs, and presents four practical DXY forex strategies applicable to different trading styles. With the euro comprising 57.6% of the DXY basket, the index functions as a near-inverse reflection of EUR/USD movements - a relationship that forms the foundation of many dollar index analysis techniques. Notably, traders can benefit from DXY insights without trading the index directly.
What Is DXY in Forex? Understanding the US Dollar Index in Forex Trading
The DXY (US Dollar Index) measures the value of the US dollar against a weighted basket of six major world currencies. The Federal Reserve created this index in 1973 following the collapse of the Bretton Woods fixed-exchange-rate system, establishing a baseline value of 100 at inception.
The index provides a single metric for assessing overall USD strength or weakness rather than evaluating the dollar against each currency individually. Futures trading on the DXY began in 1985, and the Intercontinental Exchange (ICE) currently maintains and calculates the index.
Different platforms and sources may refer to this index as DXY, USDX, USD Index, or DX - these terms are interchangeable and reference the same instrument. When the DXY reads above 100, the dollar has strengthened relative to its 1973 baseline; readings below 100 indicate relative weakness compared to that starting point.
Traders learning how to trade US Dollar Index movements can access the index through futures contracts or through CFDs offered by brokers like TIOmarkets.
The Six Currencies in the DXY Basket
The DXY basket consists of six currencies - EUR, JPY, GBP, CAD, SEK, and CHF - with the euro holding dominant weighting at 57.6%.
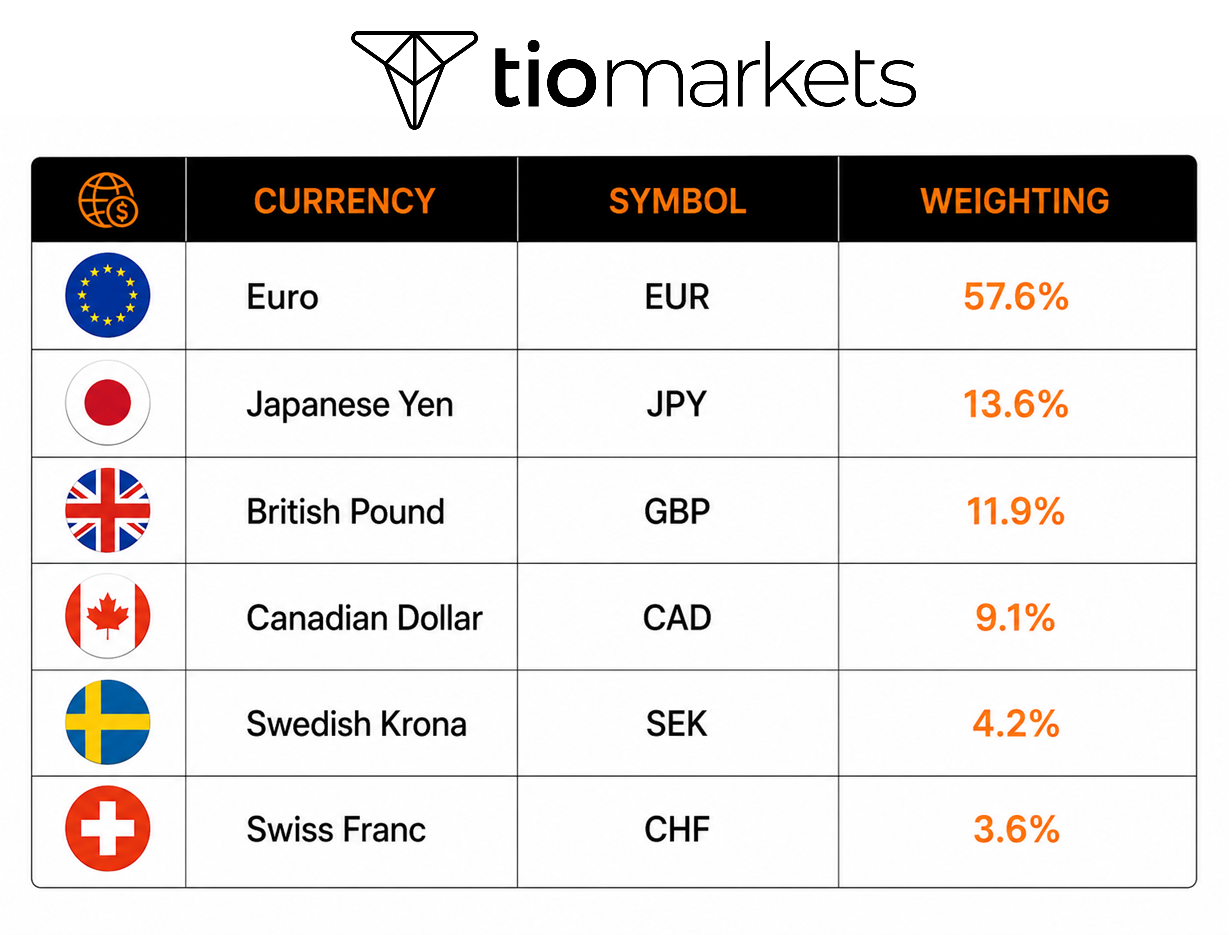
The euro's substantial weighting means DXY movements often mirror EUR/USD price action inversely - a consideration for any DXY forex strategy. The basket composition has changed only once since inception, occurring in 1999 when the euro replaced the German mark, French franc, Italian lira, Dutch guilder, and Belgian franc.
How Is the DXY Calculated?
The DXY measures the dollar against the other six currencies, with each having a fixed weight in the formula. Since the euro carries the most weight (57.6%), euro movements impact DXY the most. The calculation adjusts for how different currency pairs are quoted in forex markets: some show USD first (like USD/JPY), others show USD second (like EUR/USD). This adjustment ensures the index consistently shows whether the dollar is strengthening or weakening.
The index updates every 15 seconds during trading hours, giving traders real-time insight into overall dollar strength.
How to Use DXY to Trade Forex: Strategic Applications for Currency Traders
The USD participates in approximately 88% of all forex transactions globally, making the DXY a relevant macro indicator for most forex market participants. The index serves as a "big picture" gauge of dollar direction before traders examine individual pair dynamics.
Three Primary Ways Forex Traders Use the DXY
- Trend bias filter: The DXY trend direction can help traders determine whether to favor long or short positions on USD pairs.
- Confirmation at key levels: When DXY reaches significant support or resistance, correlated forex pairs often reach corresponding technical levels.
- Spotting divergences: When forex pairs stop moving in expected correlation with DXY, this breakdown may signal potential reversals.
DXY as a Leading Indicator for Forex Markets
Rising DXY readings generally correspond with downward pressure on pairs where USD is the quote currency (EUR/USD, GBP/USD, AUD/USD). Conversely, falling DXY readings tend to coincide with upward movement in these same pairs.
For pairs where USD is the base currency (USD/JPY, USD/CAD, USD/CHF), the relationship works in the same direction - rising DXY often accompanies rising prices in these pairs. These relationships provide context rather than certainty, as country-specific factors can override DXY signals.
How to Read the DXY Chart: A Forex Trader's Guide to Dollar Index Analysis
When analyzing the DXY chart, traders can focus on three main aspects to see how the dollar is doing.
1. Identifying the Trend Direction
- Uptrend: Higher highs and higher lows on the chart indicate the dollar is strengthening over time
- Downtrend: Lower highs and lower lows suggest the dollar is weakening
- Range-bound: Price moves sideways between support and resistance levels, showing market indecision
2. Understanding the Baseline
The DXY started at 100 in 1973 when the index was created. This serves as a reference point: if it’s above 100 it means the dollar is stronger than in 1973; if it’s below 100 it means the dollar is weaker than in 1973.
3. Key Historical Levels to Know
- All-time high = peak dollar strength: 163.83 (March 5, 1985)
- All-time low = weakest dollar on record: 70.70 (April 22, 2008)
- Inception baseline: 100 (1973)
These historical levels help traders understand where current prices sit in the broader context. For example, if DXY is at 104, the dollar is moderately strong compared to its historical range but far below its 1985 peak.
Key Technical Indicators for DXY Analysis
- Simple Moving Averages (SMA): The 9-period SMA reflects short-term momentum; 50 and 200-period SMAs indicate longer-term trend direction and support/resistance.
- Relative Strength Index (RSI): Readings above 70 suggest overbought conditions; below 30 indicates oversold. RSI divergence can signal trend exhaustion.
- MACD: Crossovers confirm trend changes; divergence from price may warn of potential reversals.
- Support and Resistance: Historical price zones where DXY reversed or consolidated. Breakouts signal bullish USD; breakdowns signal bearish USD.
Understanding DXY Correlations: How Dollar Index Movements Affect Currency Pairs
DXY correlations with forex pairs fall into two categories: positive correlation for pairs with USD as the base currency, and inverse correlation for pairs with USD as the quote currency.
- Direct (positive) correlation: Pairs with USD as the base currency (like USD/JPY, USD/CHF, USD/CAD) move in the same direction as the DXY. When DXY rises, these pairs also rise. When DXY falls, these pairs also fall.
- Inverse (negative) correlation: Pairs with USD as the quote currency (like EUR/USD, GBP/USD, AUD/USD) move in the opposite direction to the DXY. When DXY rises, these pairs fall. When DXY falls, these pairs rise.
DXY vs. Major Forex Pairs - Correlation Table
These relationships form the foundation of DXY correlation forex analysis.
| Forex Pair | DXY Correlation | When DXY Rises | When DXY Falls |
| EUR/USD | Strong Inverse | EUR/USD tends to fall | EUR/USD tends to rise |
| GBP/USD | Inverse | GBP/USD tends to fall | GBP/USD tends to rise |
| AUD/USD | Inverse | AUD/USD tends to fall | AUD/USD tends to rise |
| NZD/USD | Inverse | NZD/USD tends to fall | NZD/USD tends to rise |
| USD/JPY | Positive | USD/JPY tends to rise | USD/JPY tends to fall |
| USD/CAD | Positive | USD/CAD tends to rise | USD/CAD tends to fall |
| USD/CHF | Positive | USD/CHF tends to rise | USD/CHF tends to fall |
These correlations represent tendencies rather than guarantees; central bank decisions, geopolitical developments, and economic data releases can override DXY signals. EUR/USD typically shows the strongest inverse relationship due to the euro's 57.6% DXY weighting. Commodity currencies (AUD, NZD, CAD) maintain additional correlations with commodity prices that can complicate DXY relationships.
How to Use DXY Correlation to Confirm Forex Trades
A step-by-step approach to using DXY for trade confirmation involves checking index direction before entering positions. Consider this hypothetical example:
A trader considering a long EUR/USD position would first examine the DXY chart. If DXY shows a downtrend, this condition aligns with potential EUR/USD strength. If DXY shows an uptrend, the trader might reconsider timing or wait for additional confirmation signals. This process treats DXY as one filter among several rather than the sole decision factor.
How to Use DXY to Trade Forex: 3 Dollar Index Trading Strategies
These USDX trading strategies employ the DXY either as a primary signal source or as a confirmation filter for forex positions.
Strategy 1: The DXY Trend Confirmation Strategy
This approach uses DXY trend direction to establish directional bias for correlated forex pairs. The method involves identifying the DXY trend using the 50-period SMA (price above suggests bullish USD bias, below suggests bearish USD bias), then selecting forex pairs aligned with that assessment.
Traders following this approach wait for pullbacks on the forex pair to key support or resistance levels before entering in the direction suggested by the DXY trend. Stop losses are typically placed beyond significant nearby DXY levels.
Strategy 2: The DXY Divergence Signal Strategy
Divergence occurs when DXY and a correlated forex pair stop moving in their expected relationship, potentially signaling reversals. This strategy involves monitoring DXY and EUR/USD simultaneously on matching timeframes.
If DXY makes a new high while EUR/USD fails to make a corresponding new low, this constitutes bullish divergence on EUR/USD. Conversely, if DXY makes a new low while EUR/USD fails to make a new high, bearish divergence may be present. RSI or MACD on DXY can provide additional divergence confirmation.
Strategy 3: The DXY News Breakout Strategy
Major US economic releases (NFP, CPI, FOMC decisions) often generate significant DXY movements that translate to correlated forex pairs. This strategy involves identifying high-impact US events on economic calendars and noting DXY pre-event consolidation ranges.
Traders may place pending orders on forex pairs outside expected breakout zones, allowing automatic execution when DXY breaks from consolidation. Defined stop losses and profit targets are established before events occur.
What Drives the DXY? Key Factors That Move the US Dollar Index
Understanding DXY drivers helps traders anticipate potential index movements and their forex implications. For investors researching how to invest in US dollar assets, these fundamental factors provide essential context for timing decisions.
- Federal Reserve Policy: Rate hikes support DXY; rate cuts pressure it. FOMC dates and Fed speeches warrant monitoring.
- US Economic Data: Stronger-than-expected NFP, CPI, and GDP readings support DXY; weaker data pressures it.
- Global Risk Sentiment: Risk aversion drives safe-haven USD demand, supporting DXY. Risk appetite pressures DXY as capital seeks higher yields elsewhere.
- Component Currency Policy: ECB, BOJ, BOE, and other central bank decisions affect DXY even without US policy changes.
Common Mistakes Forex Traders Make When Using the DXY
Recognizing common DXY analysis errors can help traders avoid these pitfalls.
- Treating DXY as a standalone trading signal
- Ignoring the euro's dominant weighting
- Applying DXY signals to all forex pairs equally
- Ignoring timeframe alignment
- Overlooking divergence between DXY and forex pairs
Step-by-Step: How to Start Using DXY in Your Forex Trading Today
For traders exploring how to trade US dollar pairs more effectively, a structured approach to incorporating DXY analysis would usually follow this sequence:
- Adding the chart to the trading platform. Traders search for DXY on their trading platform and often are setting up split-screen views showing DXY alongside their chosen forex pairs.
TIOmarkets offers the possibility to also trade the index; the symbol in the trading platform appears as DXA.
- Identifying the current DXY trend. A common approach involves applying the 50-period SMA to the daily DXY chart and assessing whether the index appears to be in an uptrend, downtrend, or ranging condition.
- Determining the expected direction of the forex pair. Traders typically reference correlation data to identify how their chosen pair historically responds to DXY movements, then check whether the pair is already moving in that direction.
- Looking for entry signals. Many traders wait for pullback, breakout, or reversal patterns on the forex pair while cross-referencing RSI or MACD readings on both DXY and the forex pair for confirmation.
- Setting risk parameters before entering. Standard practice among traders includes defining stop loss levels based on key DXY support/resistance and establishing profit targets based on the next significant DXY level.
- Monitoring the DXY throughout the trade. When DXY reverses unexpectedly, many traders reassess their open positions, recognizing that DXY signals remain relevant after trade entry.
- Reviewing and refining after each trade. Traders often note whether DXY signals proved accurate and identify additional context that may have been relevant, building Dollar index technical analysis skills iteratively over time.
DXY Trading Quick-Reference Checklist
Before entering USD-related forex trades, this checklist provides a framework for DXY analysis:
- What is the current DXY trend direction? (uptrend / downtrend / ranging)
- Is my forex pair positively or inversely correlated to the DXY?
- Does the DXY trend align with my intended trade direction?
- Are there major US economic events scheduled that could shift the DXY?
- Have I checked RSI on the DXY for overbought/oversold conditions?
- Is there any divergence between DXY and my forex pair?
- Have I set a stop loss that accounts for potential DXY volatility?
- Am I using the DXY as a confirmation tool, not my only reason to trade?
The DXY represents one of the most comprehensive tools available for assessing USD strength across multiple currencies simultaneously. Traders can incorporate DXY analysis into their forex approach without trading the index directly; using it as a confirmation and correlation filter may enhance decision-making on USD-related pairs.

FAQ
Risk disclaimer: CFDs are complex instruments and come with a high risk of losing money rapidly due to leverage. You should consider whether you understand how CFDs work and whether you can afford to take the high risk of losing your money. Never deposit more than you are prepared to lose. Professional client’s losses can exceed their deposit. Please see our risk warning policy and seek independent professional advice if you do not fully understand. This information is not directed or intended for distribution to or use by residents of certain countries/jurisdictions including, but not limited to, USA & Countries included in the OFAC sanction list. The Company holds the right to alter the aforementioned list of countries at its own discretion.
TIOmarkets offers an exclusively execution-only service. The views expressed are for information purposes only. None of the content provided constitutes any form of investment advice. The comments are made available purely for educational and marketing purposes and do NOT constitute advice or investment recommendation (and should not be considered as such) and do not in any way constitute an invitation to acquire any financial instrument or product. TIOmarkets and its affiliates and consultants are not liable for any damages that may be caused by individual comments or statements by TIOmarkets analysis and assumes no liability with respect to the completeness and correctness of the content presented. The investor is solely responsible for the risk of his/her investment decisions. The analyses and comments presented do not include any consideration of your personal investment objectives, financial circumstances, or needs. The content has not been prepared in accordance with any legal requirements for financial analysis and must, therefore, be viewed by the reader as marketing information. TIOmarkets prohibits duplication or publication without explicit approval.
Join us on social media



Authors BIO

Maria is a writer and content strategist with over 10 years of experience in the finance industry. She specializes in developing research-backed articles that help financial professionals navigate complex market topics with confidence. Her expertise spans forex, stocks, CFDs and global markets, creating insightful content that educates readers and supports informed decision-making.








