Latest US data shows persistent weakness
BY Janne Muta
|April 6, 2023Risky assets showed more signs of hesitation yesterday. The S&P 500 remained practically unchanged with a 0.2% loss but Nasdaq dropped by 1.1% while the Dow Jones Industrial Average made a slight gain, rising by 0.2%. Dax traded lower by 0.46%. Gold and silver lost also some of the recent upside momentum as the USD index moved higher.

In the US, the latest data has been persistently weaker than anticipated. Reports show lower factory orders, JOLTs, ISM manufacturing data, core PCE, and consumer sentiment. Furthermore, the Atlanta Fed GDPNow model for Q1 growth has dropped significantly from 3.5% to 1.5%. In line with this trend, both the 2-year and 10-year yields in the US bond market have continued to decrease, resulting in the pricing of a 100 basis point cut in rates by January 2024, in contrast to the Fed's projection of a 5.10% Fed Funds target.
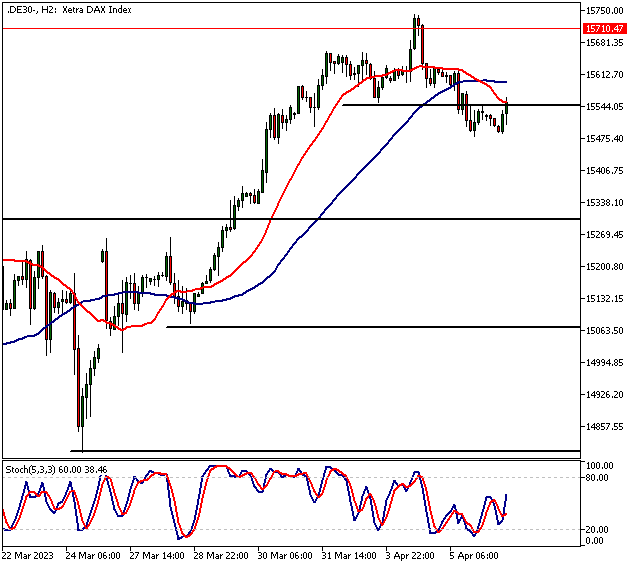
DAX
Dax is bearish below 15 550 and is likely to trade lower. The 15 380 level could on the cards. If weakness continues we might see a move to 15 260. Above the 15 550 level, the market probably trades to 15 620 or so.
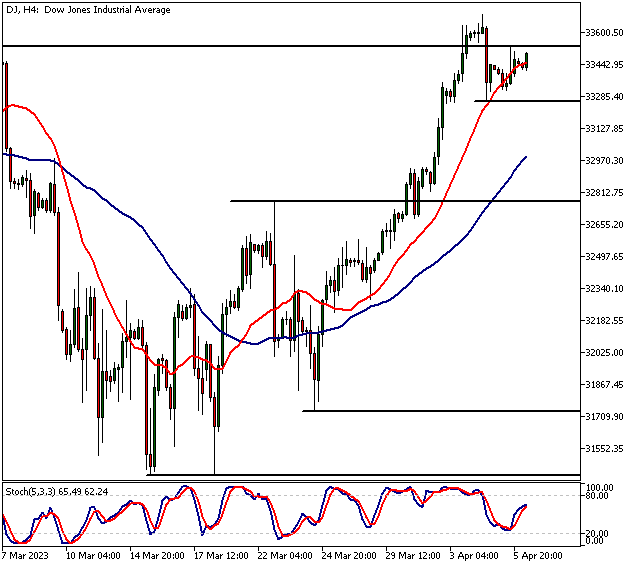
DJ
DJ is bullish above 33 272. Above the level, targeting this week’s high (33 688) makes sense for intraday traders. Below 33 272, look for a move to 33 050. Always trade your strategy and the momentum above or below the levels in my analysis reports. Don’t assume that the market will definitely move to any target price. Instead, trade your (backtested) strategy in accordance with price action around the levels we share. And, remember to use rigorous risk management to avoid oversized losses.
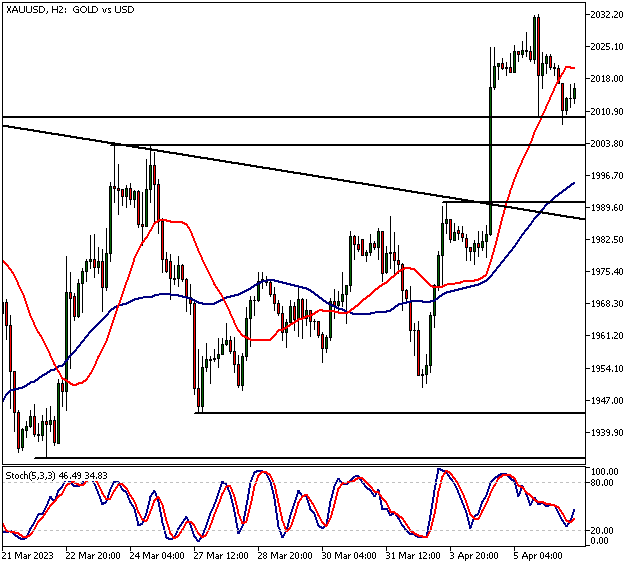
Gold
The narrow range momentum loss candle yesterday is bearish and indicates that the risk of correction has increased. However, at the time of gold trades at a support area (2003 - 2009). If the area holds it makes sense to look for long signals. However, if the market moved below the area, a move to 1987 wouldn’t be a surprise. This is where we have previous highs and the penetrated triangle high roughly in the same area (1987 - 1990). Above the 2003 - 2009 support area intraday traders might want to consider targeting the 2020 area (but only if price action supports long-side trade ideas).

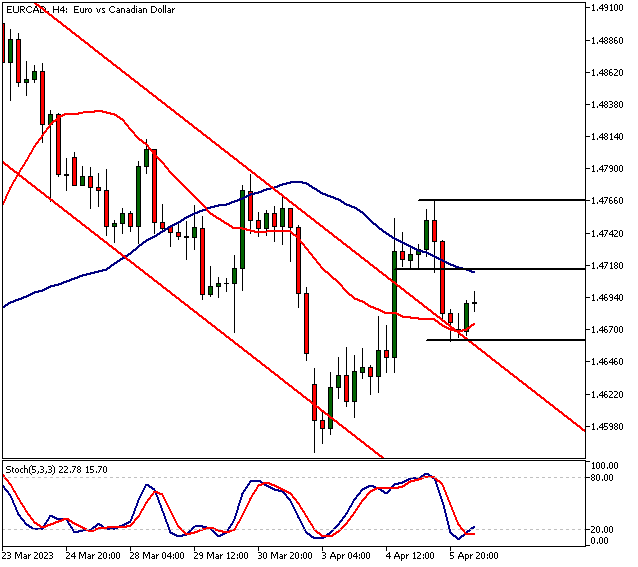
EURCAD
EURCAD remains bullish above 1.4670. If the recovery that started around this level continues we are likely to see a move back to 1.4718 or so. The market traded down to 1.4760 after the 1.4718 level was violated. Now we’ve seen some buying coming which confirms my thesis from yesterday. At the moment it seems like the bulls are in control in the 4h chart but they need to push the market above yesterday’s high to maintain the momentum.
Yesterday’s down move was a classical return move to the top of the bear channel after a breakout and if the red team can’t push the market below yesterday’s low everything looks good for the green team and we are likely to see the market moving above the 1.4767 resistance level. If yesterday’s low doesn’t hold look for a move to 1.4600 or so. Below the 1.4670 level, the market might trade down to 1.4600.
The Next Main Risk Events
- CAD Employment Change
- CAD Unemployment Rate
- USD Unemployment Claims
- CAD Ivey PMI
- USD Average Hourly Earnings m/m
- USD Non-Farm Employment Change
- USD Unemployment Rate
For more information and details see the TIOmarkets economic calendar.
Trade Safe!
Janne Muta
Chief Market Analyst
TIOmarkets.com
DISCLAIMER TIOmarkets offers exclusively consultancy-free service. The views expressed in this blog are our opinions only and made available purely for educational and marketing purposes and do NOT constitute advice or investment recommendation (and should not be considered as such) and do not in any way constitute an invitation to acquire any financial instrument or product. TIOmarkets and its affiliates and consultants are not liable for any damages that may be caused by individual comments or statements by TIOmarkets analysis and assumes no liability with respect to the completeness and correctness of the content presented. The investor is solely responsible for the risk of his/her investment decisions. The analyzes and comments presented do not include any consideration of your personal investment objectives, financial circumstances or needs. The content has not been prepared in accordance with any legal requirements for financial analysis and must, therefore, be viewed by the reader as marketing information. TIOmarkets prohibits duplication or publication without explicit approval. FX and CFDs are leveraged products. They are not suitable for every investor, as they carry a high risk of losing your capital. Please ensure you fully understand the risks involved. All the prices in this report are CFD prices based on price charts provided by TIOmarkets unless otherwise stated.

Janne Muta holds an M.Sc in finance and has over 20 years experience in analysing and trading the financial markets.
Related Posts


Trade responsibly: CFDs are complex instruments and come with a high risk of losing all your invested capital due to leverage.