Less hawkish RBA statement pressured the AUD
BY Janne Muta
|March 7, 2023The RBA hiked the cash rate by only 25 bp in the Asian session. The (dovish) decision was in line with market expectations and took the rate to 3.6%. The statement accompanying the decision showed the Australian central bank governor Lowe promising more rate hikes but with a less hawkish tone compared to February.

The expectation is that the RBA is only hiking once more and will then monitor the data to evaluate the need for future rate hikes. The central bank doesn’t (in light of the current data) expect inflation to become sticky. In other words, the bank expects that wages and prices don’t create a cycle in which they chase each other. Today’s key risk event: Fed Chair Powell Testifies.
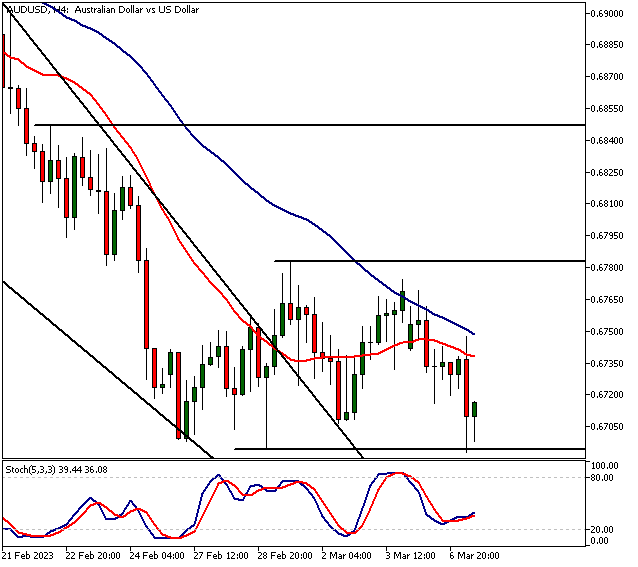
AUDUSD heads south after the RBA decision
AUDUSD dived lower following the dovish rate decision and rather dovish wording in the statement. The fact that the pair wasn’t able to rally to the 0.6783 resistance (a lower high was created) was an early warning sign but the less hawkish tone from the RBA really makes it difficult to argue that AUDUSD is turning bullish. The market is trading at support (0.6695) but now there are serious questions about whether the support will hold. For the technical picture to turn bullish the market needs to decisively take out the 0.6783 resistance. Otherwise, we might see the pair drifting down to 0.6650.
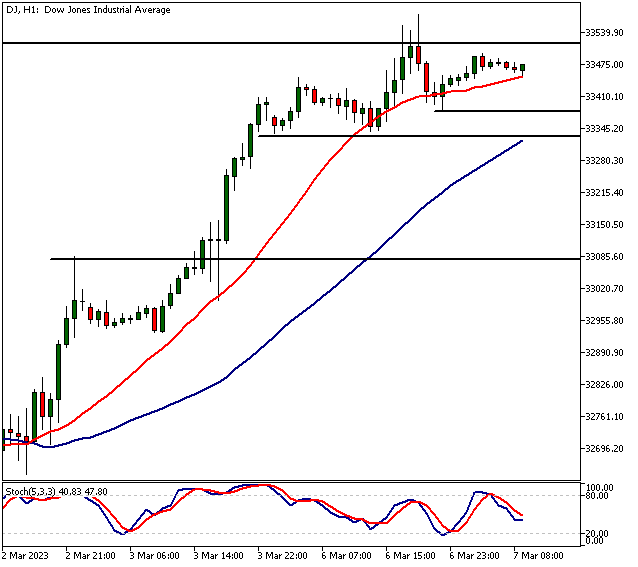
DJ is approaching a key resistance area
Yesterday was a momentum-loss day in DJ. The market created a shooting star candle in the daily chart. This means the 33 334 – 33 384 range is now a key support area. If buyers defend the area the uptrend is intact but a decisive break below the level could lead to a deeper down move. If you trade the long side, remember that the probability of long signals failing in this context is greater. This doesn’t mean they can’t work, but rather that the probability distribution is now different than a couple of days ago when there was strong momentum in the market. Pay attention to how the price reacts to support levels and consider taking profits sooner than you would have done when the trend was strong. The nearest resistance area is at 33 575 – 33 600.
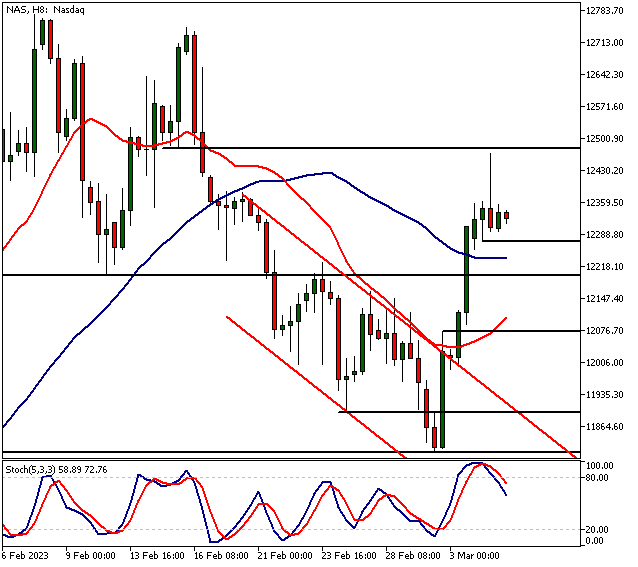
Shooting star in NAS
Nasdaq has also created a rejection candle in the daily timeframe so much of what I write above on trading the Dow does apply to Nasdaq also. The key support level in Nasdaq is 12 274. If the level breaks 12 165 – 12 200 is likely to come into play. The nearest resistance area is at 12 466 – 12 485.
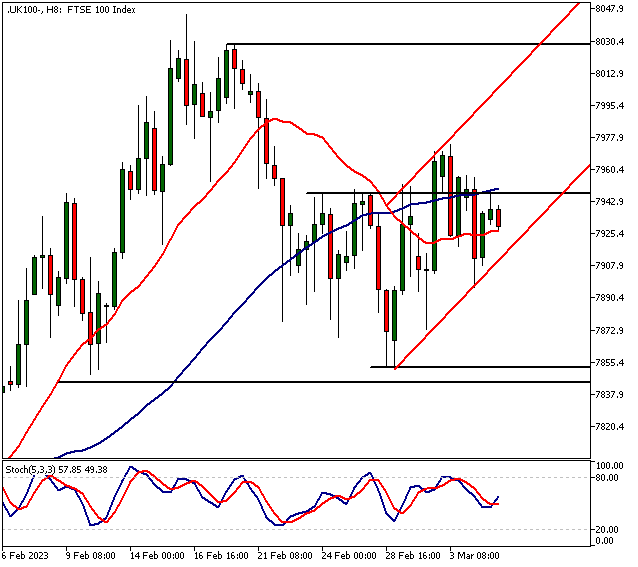
FTSE created higher swing lows
FTSE continues building a base. The market has tried to break out of the range once but has so far failed to create a decisive breakout. What’s promising though is the fact that the bulls have been willing to buy the dips higher than before. This has created two higher swing lows and if this continues the process will lead to a rally that could take the market to 7961. However, keep an eye on how FTSE reacts to the potential weakness in the US indices. If DJ and NAS start to sell off heavily it’s bound to have an impact on FTSE.

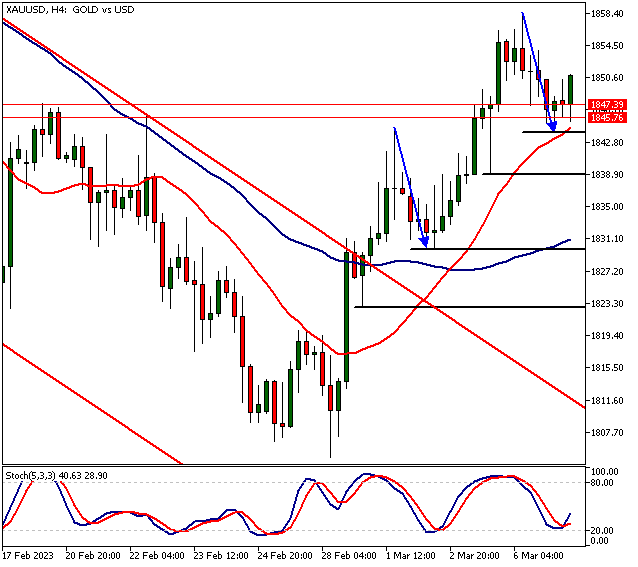
The retracement in gold could be over
Gold’s retracement has now been almost exactly equal in size compared to the previous retracement during this rally (see the blue arrows). Gold’s uptrend remains intact above 1839 but if the level breaks we might see a move down to 1828 or so. If the uptrend gains traction again, the next key resistance level to focus on is at 1870.
The Next Main Risk Events
- USD Fed Chair Powell Testifies
- CHF SNB Chairman Jordan Speaks
- AUD RBA Gov Lowe Speaks
- EUR ECB President Lagarde Speaks
- USD ADP Non-Farm Employment Change
- CAD BOC Rate Statement
- CAD Overnight Rate
- USD Fed Chair Powell Testifies
- USD JOLTS Job Openings
- USD 10-y Bond Auction
- USD Unemployment Claims
- JPY Monetary Policy Statement
- JPY BOJ Press Conference
- GBP GDP m/m
- CAD Employment Change
- CAD Unemployment Rate
- USD Average Hourly Earnings m/m
- USD Non-Farm Employment Change
- USD Unemployment Rate
For more information and details see the TIOmarkets economic calendar.
Trade Safe!
Janne Muta
Chief Market Analyst
TIOmarkets
DISCLAIMER TIOmarkets offers exclusively consultancy-free service. The views expressed in this blog are our opinions only and made available purely for educational and marketing purposes and do NOT constitute advice or investment recommendation (and should not be considered as such) and do not in any way constitute an invitation to acquire any financial instrument or product. TIOmarkets and its affiliates and consultants are not liable for any damages that may be caused by individual comments or statements by TIOmarkets analysis and assumes no liability with respect to the completeness and correctness of the content presented. The investor is solely responsible for the risk of his/her investment decisions. The analyzes and comments presented do not include any consideration of your personal investment objectives, financial circumstances or needs. The content has not been prepared in accordance with any legal requirements for financial analysis and must, therefore, be viewed by the reader as marketing information. TIOmarkets prohibits duplication or publication without explicit approval. FX and CFDs are leveraged products. They are not suitable for every investor, as they carry a high risk of losing your capital. Please ensure you fully understand the risks involved. All the prices in this report are CFD prices based on price charts provided by TIOmarkets unless otherwise stated.

Janne Muta holds an M.Sc in finance and has over 20 years experience in analysing and trading the financial markets.
Related Posts


Trade responsibly: CFDs are complex instruments and come with a high risk of losing all your invested capital due to leverage.