


Mean Reversion Trading Strategy: The Complete Guide
BY Maria K.
|July 14, 2026What if the most useful edge in trading wasn't about predicting where prices are going but simply recognizing how far they've already gone? Asset prices don't move in straight lines, they oscillate around a long-term average, creating opportunities for traders who understand this dynamic. A mean reversion trading strategy capitalizes on this natural tendency, offering a systematic approach to identifying when prices have deviated too far from their norm.
Read on and by the end of this guide, you should have a better understanding of how to identify, enter, manage, and exit mean reversion trades. This comprehensive resource covers everything from foundational principles to advanced indicator combinations and multi-asset applications.
Key Takeaways
- Mean reversion is the tendency of asset prices to return to their historical average after extreme moves
- It works best in range-bound, sideways markets
- Key tools include Bollinger Bands, RSI, Moving Averages, and Z-Score analysis
- Risk management is critical, not every deviation reverts
- Mean reversion can be applied to stocks, forex, commodities, and volatility
What Is Mean Reversion? The Core Concept Explained
Mean reversion is the financial theory that asset prices, returns, and other metrics tend to return to their long-term historical average over time. When a stock, currency pair, or commodity moves significantly above or below its typical value, this theory suggests that price will eventually gravitate back toward that central point.
When traders reference "the mean," they refer to a historical average price, a moving average calculated over a specific period, or another statistical benchmark that represents the asset's typical value. The specific definition of the mean depends on the trading system and timeframe being employed.
Why Does Mean Reversion Happen in Financial Markets?
Markets many times overreact to news, earnings, and sentiment shifts, pushing prices beyond fundamental value and creating temporary mispricings that eventually correct. When prices deviate significantly from fair value, market participants step in to capitalize on the discrepancy, pulling prices back toward equilibrium.
What Assets Does Mean Reversion Apply To?
Mean reversion principles can be observed across virtually every liquid financial market:
- Stocks and equities often revert around earnings cycles and sector valuations
- Forex currency pairs frequently exhibit range-bound behavior suitable for mean reversion
- Commodities like oil and gold oscillate around supply/demand equilibrium prices
- Volatility indices like the VIX are among the most reliably mean-reverting metrics in finance
- ETFs and index funds track baskets of assets that collectively demonstrate mean-reverting tendencies
- Interest rates and P/E ratios tend to cycle around historical norms over longer timeframes
How the Mean Reversion Trading Strategy Works (Step-by-Step)
A mean reversion trading system follows four core phases: identify the mean, detect the deviation, generate a signal, and execute and manage the trade. Understanding each phase allows traders to build a structured, repeatable approach.
Step 1: Establish the Mean (Your Baseline)
The foundation of any mean reversion approach is calculating a baseline that represents the asset's "normal" price level.
You do that by using a moving average, typically a Simple Moving Average (SMA), Exponential Moving Average (EMA), or Weighted Moving Average (WMA), calculated over a specific number of periods. Choosing the timeframe is based on your trading style: 20-period for short-term trading, 50-period for swing trading, or 200-period for longer-term positions.
The basic formula for calculating a simple mean is: Mean = Sum of Prices ÷ Number of Observations
Step 2: Measure the Deviation
Once you've established the mean, the next step is measuring how far price has strayed from it. Standard deviation provides a statistical measure of this distance. The Z-Score formula offers the most statistically rigorous deviation measure: (Current Price – Mean) ÷ Standard Deviation.
| Z-Score Range | Market Condition | Potential Signal |
| Above +2.0 | Significantly overbought | Consider short / sell |
| +1.5 to +2.0 | Mildly overbought | Monitor for reversal |
| -1.5 to +1.5 | Near the mean | No clear signal |
| -1.5 to -2.0 | Mildly oversold | Monitor for reversal |
| Below -2.0 | Significantly oversold | Consider long / buy |
Step 3: Confirm the Signal with an Indicator
Many traders use confirmation indicators to help filter potential false signals. Some traders combine multiple indicators to seek additional confirmation. Read the next section to learn more about the best indicators used in mean reversion trading strategies.
Step 4: Execute the Trade (Entry Rules)
With a confirmed signal in hand, execution follows specific rules. When the price falls or rises significantly below or above the mean AND a confirmation indicator shows oversold or overbought conditions, some traders may interpret this as a potential long or short setup.
Step 5: Manage the Trade (Target and Stop-Loss)
In mean reversion trading, the target is typically the mean itself: the moving average or baseline you established in Step 1. Stop-loss placement follows market structure, so for long trades is just below the recent swing low and for short trades, just above the recent swing high.
Key Mean Reversion Indicators for Your Trading
The right indicator can mean the difference between a high-probability signal and a costly false alarm. Here are the most effective tools for mean reversion trading.
Bollinger Bands: The Visual Mean Reversion Indicator
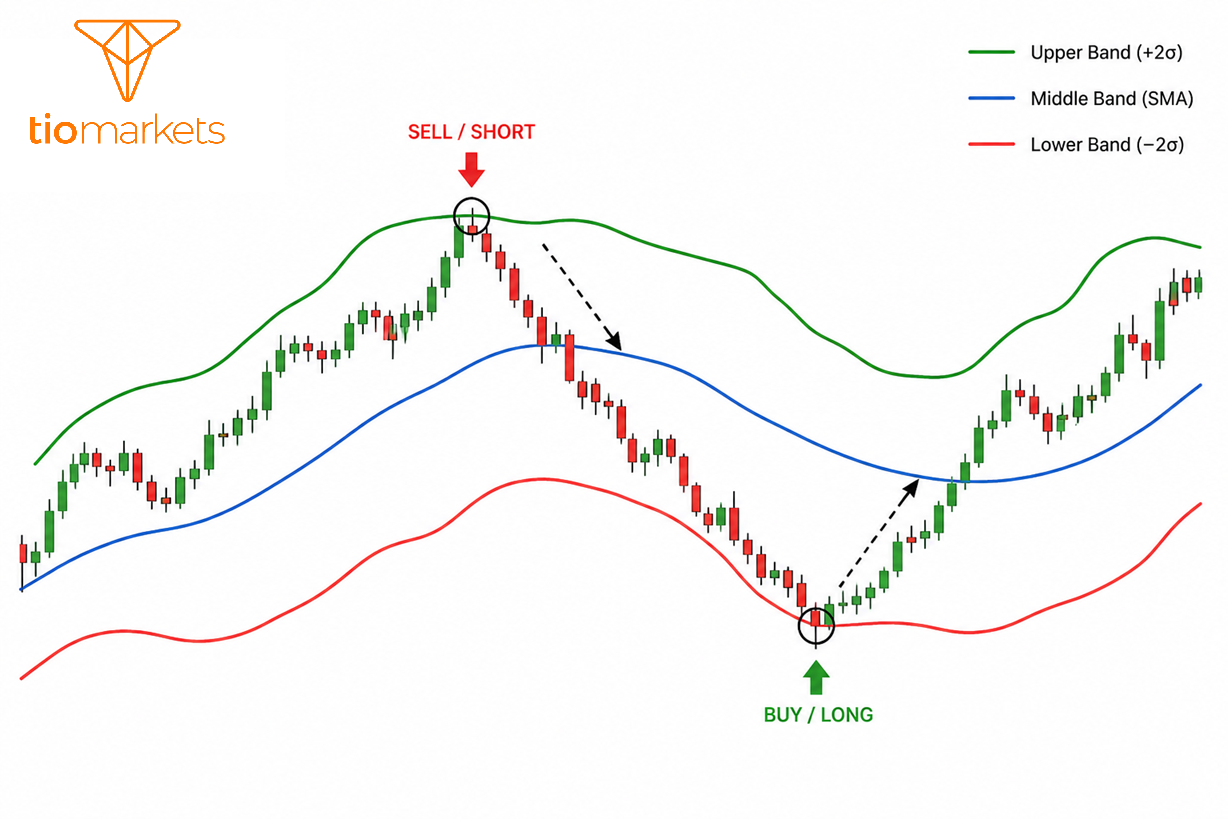
Bollinger Bands consist of a middle SMA band with upper and lower bands set at 2 standard deviations above and below it. This creates a dynamic envelope that expands and contracts with market volatility.
For mean reversion purposes, price touching or breaking the end bands may suggest potential overbought/oversold conditions. The target for both scenarios is the middle band: the mean.
Relative Strength Index (RSI): The Momentum Confirmation Tool
RSI measures the speed and magnitude of price movements on a scale from 0 to 100. For mean reversion applications, RSI readings above 70 are commonly interpreted by traders as overbought conditions and potential sell opportunities, while readings below 30 suggest oversold conditions and potential buy opportunities.
Moving Averages: The Foundation of Every Mean Reversion System
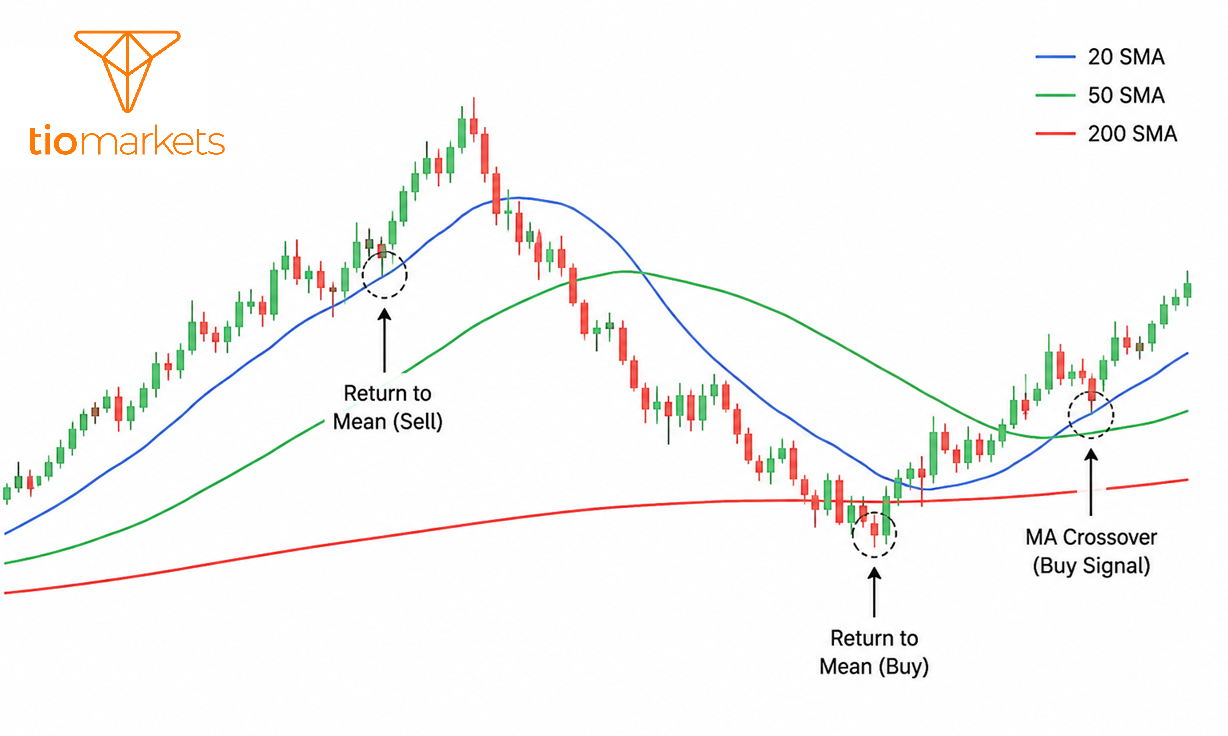
Moving averages serve as the backbone of virtually every mean reversion approach. There are many types, each with its unique characteristics. The simple moving average (SMA) calculates the average price over a specific period while the exponential moving average (EMA) gives more weight to recent prices, making it more responsive to new information.The choice between SMA and EMA depends on your preference for responsiveness versus smoothness. EMAs react faster to recent price changes, while SMAs provide more stable reference points.
The 20, 50, and 200-period SMAs function as dynamic support and resistance levels, doubling as mean reference points. When price returns to a moving average after a significant deviation, you're witnessing one example of mean reversion behaviour.
MACD (Moving Average Convergence Divergence): Momentum Deviation Signal
MACD measures the distance between two exponential moving averages, typically the 12 and 26-period EMAs. When the MACD lines diverge significantly from the zero line, it signals that price has deviated substantially from its mean. Crossovers that occur near extreme levels may be interpreted as potential entry signals.
Z-Score Deviation: The Quantitative Trader's Tool
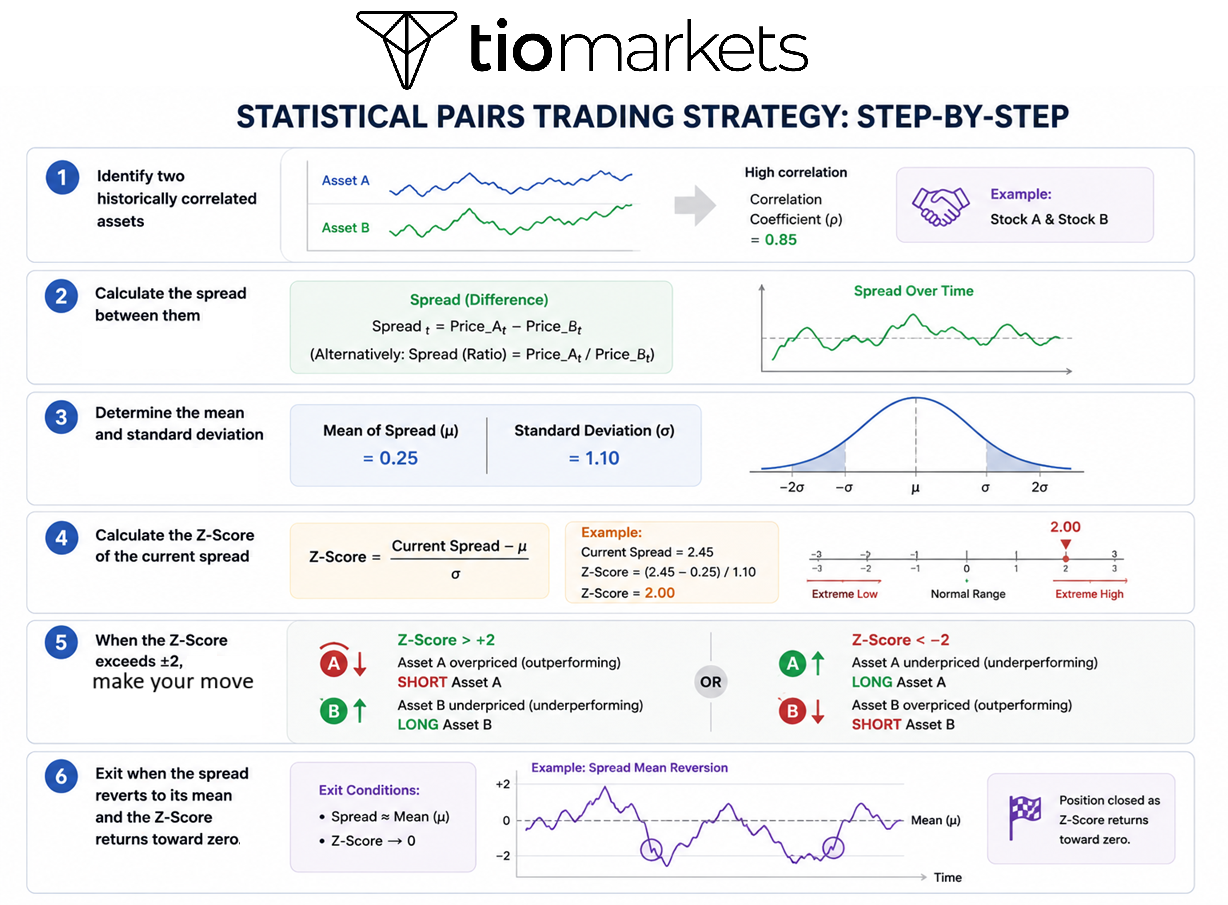
The Z-Score provides one statistically based approach to identifying mean reversion opportunities. Quantitative and algorithmic traders frequently use Z-Score as their primary trigger for systematic mean reversion systems. Z-Score analysis proves particularly valuable for pairs trading and statistical arbitrage strategies.
| Indicator | Type | Best For | Signal Threshold | Timeframe |
| Bollinger Bands | Volatility/Trend | All styles | Price outside 2 SD bands | Any |
| RSI | Momentum | Confirmation | >70 / <30 | Any |
| Moving Averages | Trend | Baseline mean | Price far from MA | Any |
| MACD | Momentum | Deviation signal | Extreme divergence | Swing/Day |
| Stochastic | Momentum | Short-term exhaustion | >80 / <20 | Intraday |
| Z-Score | Statistical | Quant/Algo trading | ±2.0 | Any |
When and How to Use Mean Reversion Strategies in Your Trading: 5 Approaches
Mean reversion strategy works best in specific market conditions so here are five top approaches to identify price deviations across different trading scenarios.
Simple Moving Average Mean Reversion Strategy (common for beginners)
This approach uses the 50 EMA as the mean reference point combined with a 14-period RSI for confirmation. The simplicity makes it ideal for traders new to mean reversion concepts.
Traders look for long entries when price drops significantly below the 50 EMA with RSI below 30, or short entries when price rises significantly above the 50 EMA with RSI above 70. The 50 EMA itself serves as the exit target, making this a straightforward system for learning fundamental mean reversion mechanics.
Bollinger Band Mean Reversion Strategy (widely used)
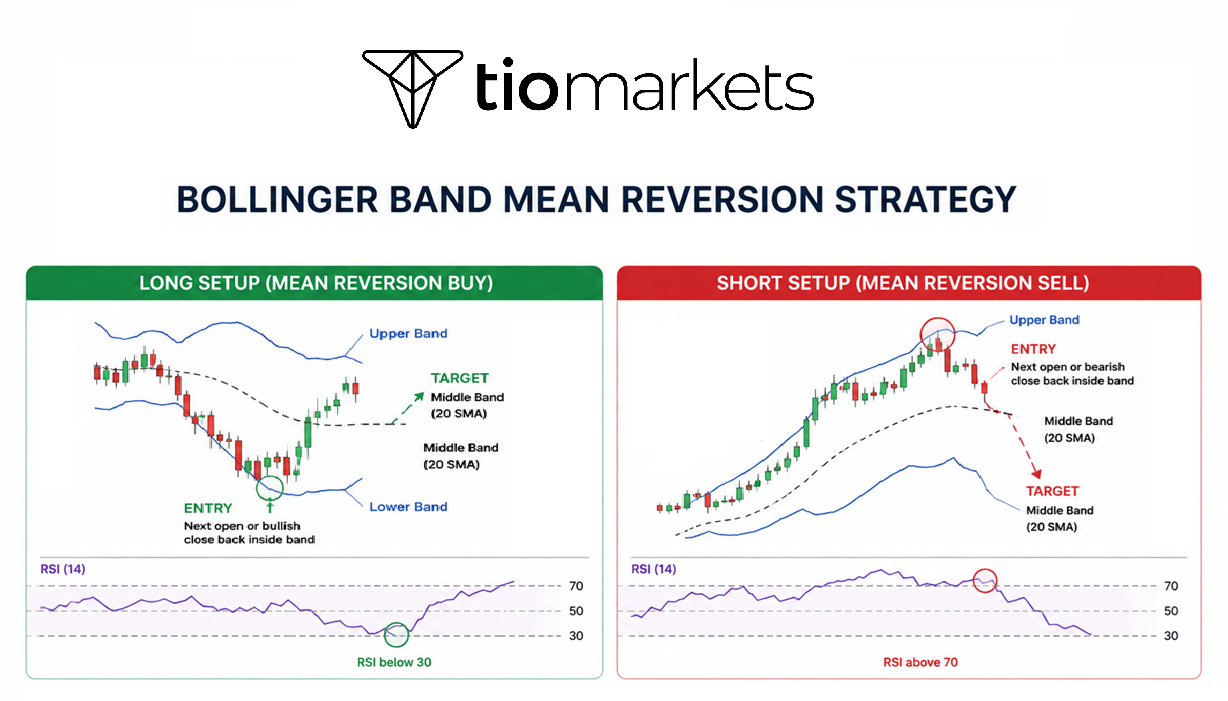
The Bollinger Band approach uses 20 SMA-based bands with 2 standard deviations, confirmed by RSI or Stochastic readings. Its popularity stems from the visual clarity it provides and its statistical foundation.
Traders would look for long entries when price closes below the lower band with RSI below 30, or short entries when price closes above the upper band with RSI above 70. Entry timing typically occurs on the next candle open or upon a confirming candle close back inside the band. This approach is preferred because, statistically, price spends the vast majority of its time within the bands, making excursions outside them likely to revert.
Pairs Trading Mean Reversion Forex Strategy (Market-Neutral Approach)
Pairs trading involves going long one correlated asset while simultaneously shorting another when their price relationship deviates from historical norms. This market-neutral approach aims to reduce exposure regardless of overall market direction. Identifying suitable pairs requires finding assets with a correlation coefficient above 0.80, typically within the same sector or industry. Classic examples include Gold versus Silver, EUR/USD versus GBP/USD, Coca-Cola versus Pepsi, and Brent Crude versus WTI Crude.
Intraday Mean Reversion Strategy (For Day Traders)
Intraday mean reversion operates on 1-minute to 15-minute charts, using VWAP (Volume Weighted Average Price) as the primary mean reference. VWAP is widely used as an intraday reference level.
Traders look for long entries when price drops significantly below VWAP with oversold RSI conditions, or short entries when price spikes above VWAP with overbought RSI. Exits typically target the VWAP line, with this strategy often favoured during the first and last hours of trading when volume is highest.
Volatility Mean Reversion Strategy (Advanced)
Volatility is often considered to exhibit mean-reverting characteristics. When the VIX spikes to extreme highs during fear-driven selloffs, volatility tends to revert lower, creating opportunities to sell volatility or buy equities. Conversely, when VIX reaches extreme lows during complacent periods, volatility tends to spike, creating opportunities to buy protection.
Tools for this approach include Bollinger Bands applied to the VIX itself, comparison between historical and implied volatility, and ATR (Average True Range) deviation analysis. Execution methods range from options selling during high implied volatility periods to long straddles when implied volatility is unusually low, as well as ETF-based volatility strategies.
When Mean Reversion Trading Fails: Red Flags to Watch For
Mean reversion is a statistical tendency, not a guarantee. Every mean reversion trade carries risk. So understanding when mean reversion fails is just as important. Several market conditions can undermine mean reversion approaches.
Strong Trending Markets: In powerful uptrends or downtrends, prices can remain "overbought" or "oversold" for extended periods. RSI can stay above 70 for weeks during a strong bull run, and repeatedly fading such moves becomes a losing proposition.
Fundamental Regime Changes: If a company reports a fraud scandal, faces regulatory action, or enters bankruptcy, the stock price may never revert to its previous mean - the mean itself has permanently shifted lower. Similarly, a company experiencing explosive growth through a new product or market expansion may establish an entirely new, higher mean.
Low-Liquidity Markets: In thinly traded markets, extreme price moves may not attract enough counter-pressure to generate reversion. Wider spreads also make it more difficult to enter and exit at desired prices, increasing friction costs.
Black Swan Events: Major unexpected events such as geopolitical crises, pandemics, or central bank policy shocks can cause prices to deviate from their mean for months or years.
Risk Management for Mean Reversion Trading: How to Protect Your Capital
Mean reversion is a favoured practice, but losing trades can also be substantial if a trend develops. Proper risk management is non-negotiable for long-term success.
Stop-Loss Placement: Stops are typically placed below recent swing lows for long trades or above recent swing highs for short trades.
Position Sizing: The 1-2% rule is common, with position size calculated as: (Account Risk $) ÷ (Entry Price – Stop-Loss Price).
Trade Invalidation: Setups may be considered invalid if price makes new extremes before entry, major news changes the outlook, or the asset breaks out of its range with volume confirmation.
Avoiding "Falling Knives": Traders often wait for confirmation candles (bullish engulfing, hammers, dojis) and use multiple timeframe analysis to reduce the risk of entering too early into continued declines.
Pros and Cons of the Mean Reversion Trading Strategy
Like all trading approaches, mean reversion has distinct strengths and limitations that traders should understand.
Advantages of Mean Reversion Trading
Mean reversion offers several characteristics that appeal to many traders.
- Clear entry and exit rules: The mean defines your target while the extreme defines your entry. This clarity eliminates much of the ambiguity present in other approaches.
- Can be effective in range-bound markets: Mean reversion generates opportunities precisely when trend-following strategies struggle.
- Versatility across asset classes: The same principles apply to stocks, forex, commodities, and volatility products, allowing diversified application.
- Can be automated using rule-based systems: The rules-based nature makes mean reversion ideal for algorithmic and systematic trading implementation.
- Diversification benefit: Low correlation to trend-following strategies means combining both approaches can smooth overall portfolio returns.
- Short trade duration: Many mean reversion trades resolve quickly, reducing overnight risk and capital commitment.
Risks and Limitations of Mean Reversion Trading
At the same time, this strategy poses its own risks and limitations. Always keep in mind that trading CFDs and leveraged products involves significant risk of loss and past performance is not a reliable indicator of future results.
- Fails in trending markets: Mean reversion can produce significant drawdowns when strong trends develop and prices refuse to revert.
- Psychologically challenging: Buying falling assets and selling rising ones runs counter to human instinct, making execution difficult without systematic rules.
- Transaction costs: Frequent trading increases commission and spread costs, which can erode profits from smaller mean reversion gains.
- False signals: Especially on shorter timeframes, market noise generates false signals that result in stopped-out trades.
- The mean can shift: Historical averages may not represent current fair value if fundamentals have changed, invalidating reversion expectations.
- Requires constant monitoring: Especially for intraday strategies, mean reversion often demands active attention to evolving market conditions.
Is Mean Reversion Trading Strategy Right for You?
Mean reversion represents a statistically grounded, time-tested approach to trading that exploits the natural tendency of prices to return to their historical average. The key strategies covered in this guide serve different trading styles and timeframes. What unites them is the core principle of identifying when prices have stretched too far from normal and positioning for the return journey.
Mean reversion strategies tend to perform best in range-bound, sideways conditions and can struggle or fail outright during strong trending periods. Markets may experience periods of oscillation, overreaction, and eventually correction. But the ability to recognize which environment you're trading in could be the most valuable skill a mean reversion trader can develop.
When you feel ready to test your abilities, start with a demo account to practise in a risk-free environment before committing real capital. Remember that trading involves substantial risk, and you should never trade with funds you cannot afford to lose.

FAQ
Risk disclaimer: CFDs are complex instruments and come with a high risk of losing money rapidly due to leverage. You should consider whether you understand how CFDs work and whether you can afford to take the high risk of losing your money. Never deposit more than you are prepared to lose. Professional client’s losses can exceed their deposit. Please see our risk warning policy and seek independent professional advice if you do not fully understand. This information is not directed or intended for distribution to or use by residents of certain countries/jurisdictions including, but not limited to, USA & Countries included in the OFAC sanction list. The Company holds the right to alter the aforementioned list of countries at its own discretion.
TIOmarkets offers an exclusively execution-only service. The views expressed are for information purposes only. None of the content provided constitutes any form of investment advice. The comments are made available purely for educational and marketing purposes and do NOT constitute advice or investment recommendation (and should not be considered as such) and do not in any way constitute an invitation to acquire any financial instrument or product. TIOmarkets and its affiliates and consultants are not liable for any damages that may be caused by individual comments or statements by TIOmarkets analysis and assumes no liability with respect to the completeness and correctness of the content presented. The investor is solely responsible for the risk of his/her investment decisions. The analyses and comments presented do not include any consideration of your personal investment objectives, financial circumstances, or needs. The content has not been prepared in accordance with any legal requirements for financial analysis and must, therefore, be viewed by the reader as marketing information. TIOmarkets prohibits duplication or publication without explicit approval.
Join us on social media



Authors BIO

Maria is a writer and content strategist with over 10 years of experience in the finance industry. She specializes in developing research-backed articles that help financial professionals navigate complex market topics with confidence. Her expertise spans forex, stocks, CFDs and global markets, creating insightful content that educates readers and supports informed decision-making.





