Nasdaq 100 Technical Analysis | Dovish Fedtalk supports technology stocks
BY Janne Muta
|November 29, 2023Nasdaq 100 Technical Analysis - In his speech, Federal Reserve Governor Christopher Waller supported extending the pause in rate increases into early next year. According to WSJ, he cited recent economic data indicating a slowdown and a decline in inflation. The Federal Reserve last raised rates in July and has held them steady since then, with the possibility of continuing this pause into late January.
Waller also addressed concerns about market rallies and bond market reversals potentially easing financial conditions. He noted that despite the recent easing, financial conditions remain tighter than they were mid-year.
This is evident as long-term Treasury yields are still higher than they were when the Fed last raised rates in July. Governor Bowman, who also expressed a dovish stance in her speech, prioritized economic growth and high employment, even at the cost of slightly higher inflation.
The shift of Fed officials towards a more dovish outlook, combined with a strong economy as highlighted by robust growth in Black Friday spending, is supportive of equity markets. This environment is particularly conducive to attracting more funds to market leaders, especially in the Nasdaq index.
The Wall Street Journal reported earlier that the Black Friday shopping season appeared to be strong. U.S. retail sales on Black Friday jumped by 2.5% from the previous year, and physical store traffic also saw an increase. Notably, Shopify reported a 22% surge in Black Friday sales, and Amazon observed a 20% increase in online spending.
Summary of This Nasdaq 100 Technical Analysis Report:
- After rallying over 14% from its October low, the NASDAQ has lost some momentum upon reaching the July high of 15,931. The market has since created a new year-to-date (YTD) high at 16,123. It’s worth noting that the October low at 14,056 represents a higher swing low in the long-term context.
- The market rallied almost 50% from the December 2022 low to the July 2023 high. Therefore, the 11.6% retracement from the July high to the October low is merely a retracement in this context.
- NASDAQ has created a higher swing low near the July high at 15,931. This is the second higher reactionary low after the market first tested this level on November 15th. The indication is that technology-oriented investors are willing to pay higher prices even after the market has already rallied 11% in a very short period.
Read the full Nasdaq 100 technical analysis report below.
Nasdaq 100 Technical Analysis
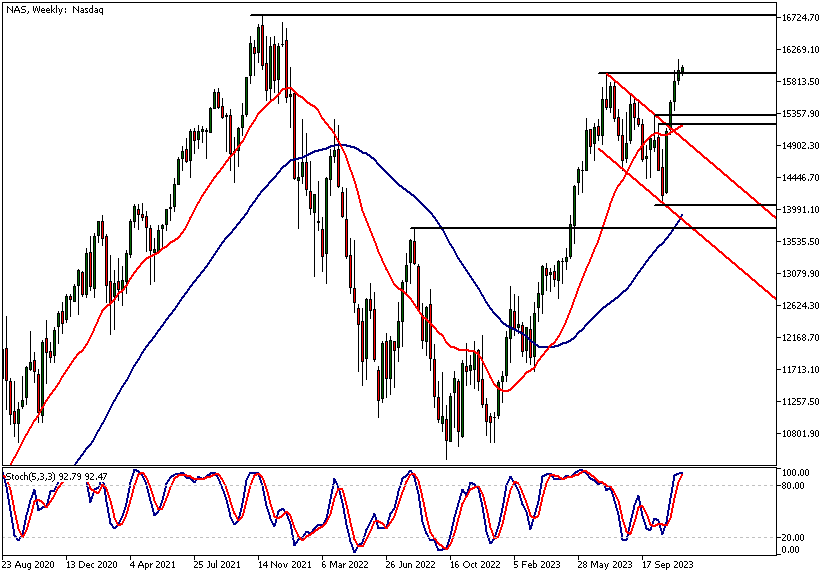
Weekly Nasdaq 100 Technical Analysis
After rallying over 14% from its October low, the NASDAQ has lost some momentum upon reaching the July high of 15,931. The market has since created a new year-to-date (YTD) high at 16,123. It’s worth noting that the October low at 14,056 represents a higher swing low in the long-term context.
The market rallied almost 50% from the December 2022 low to the July 2023 high. Therefore, the 11.6% retracement from the July high to the October low is merely a retracement in this context.
Upside potential
Our NASDAQ 100 technical analysis indicates that the market could still have substantial upside ahead on the weekly timeframe chart. This doesn't mean that the market will immediately rally substantially. Instead, it seems likely that the market could trend higher with occasional pullbacks and retracements, as is common in markets.
The nearest key support level is the July high at 15,931. Above this level, we could see a move to around 16,315. Below this level, the nearest support area can be found at 14,544 - 14,813. This market structure area coincides with the 20-period moving average and is therefore likely to be a significant reference point should there be a deep retracement that takes the market back to this price range.
Indicators support the bullish view
The strong rally has driven the moving averages higher, pointing upwards and reflecting bullishness in the market. Therefore, indicator-based NASDAQ 100 technical analysis supports the long-term bullish market view given by price action-based analysis.
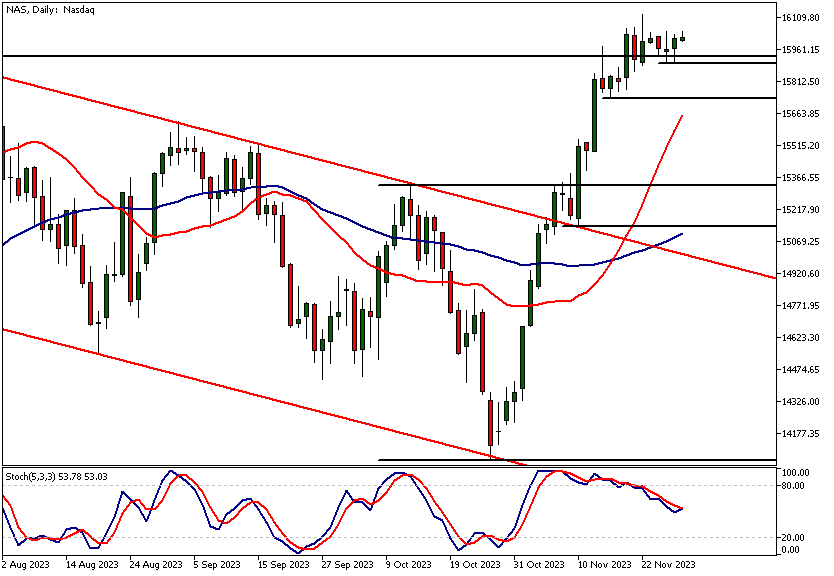
Daily Nasdaq 100 Technical Analysis
NASDAQ has created a higher swing low near the July high at 15,931. This is the second higher reactionary low after the market first tested this level on November 15th.
Bullish technology investors
The indication is that technology-oriented investors are willing to pay higher prices even after the market has already rallied 11% in a very short period. Therefore, we could see further upside, even though the market momentum has somewhat slowed over the last few days.
Our NASDAQ 100 technical analysis suggests that the market remains bullish on the daily charts as long as traders are willing to defend levels at or above the 15,732 support level. Below this level, a move down to 15,340 could be likely.
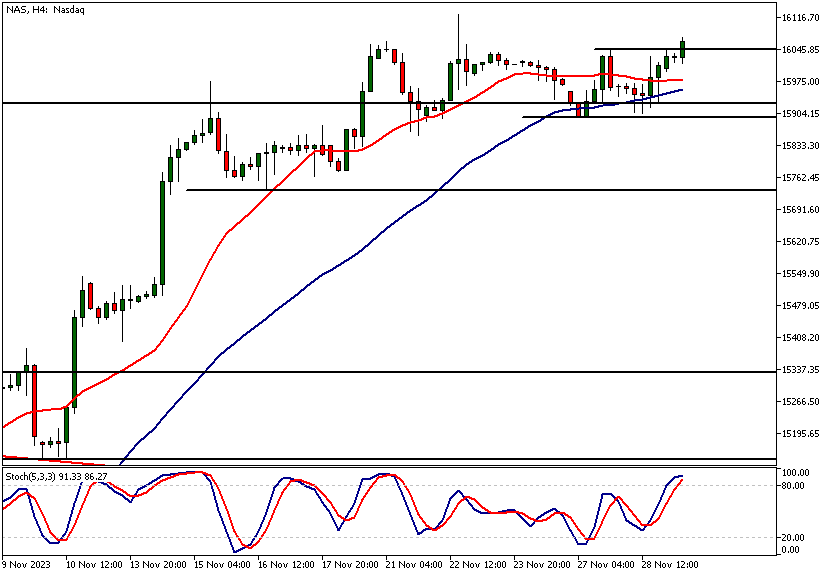
Nasdaq 100 Technical Analysis, 4h Chart
The 4-hour chart shows the NASDAQ 100 cfd price breaking out of a tight price range between 15,894 and 16,045. Measured move targets based on the width of the sideways range are at 16,217 and 15,372. Utilizing NASDAQ 100 technical analysis with a focus on moving averages, we can conclude that the market is in one of those sideways moves that often occur after strong upward moves.
The next key risk events for this market
- US Prelim GDP
- US Prelim GDP Price Index
- US Core PCE Price Index m/m
- US Unemployment Claims
- US Chicago PMI
- US Pending Home Sales
- US ISM Manufacturing PMI
- US ISM Manufacturing Prices
- US Fed Chair Powell Speaks

Potential Nasdaq 100 Market Moves
The nearest key support level is the July high at 15,931. Above this level, we could see a move to around 16,315. Below this level, the nearest support area can be found at 14,544 - 14,813.
How would you trade the Nasdaq 100 today?
I hope this Nasdaq 100 technical analysis helps you to make better informed trading decisions. Check the latest market analysis for other instruments and subscribe to receive them in your inbox as soon as they are published
DISCLAIMER: TIO Markets offers an exclusively execution-only service. The views expressed are for information purposes only. None of the content provided constitutes any form of investment advice. The comments are made available purely for educational and marketing purposes and do NOT constitute advice or investment recommendation (and should not be considered as such) and do not in any way constitute an invitation to acquire any financial instrument or product. TIOmarkets and its affiliates and consultants are not liable for any damages that may be caused by individual comments or statements by TIOmarkets analysis and assumes no liability with respect to the completeness and correctness of the content presented. The investor is solely responsible for the risk of his/her investment decisions. The analyses and comments presented do not include any consideration of your personal investment objectives, financial circumstances, or needs. The content has not been prepared in accordance with any legal requirements for financial analysis and must, therefore, be viewed by the reader as marketing information. TIOmarkets prohibits duplication or publication without explicit approval.

Janne Muta holds an M.Sc in finance and has over 20 years experience in analysing and trading the financial markets.
Related Posts


Trade responsibly: CFDs are complex instruments and come with a high risk of losing all your invested capital due to leverage.