Nasdaq 100 Technical Analysis | Fed might cut rates before inflation hits 2%
BY Janne Muta
|January 24, 2024Nasdaq 100 Technical Analysis - Yesterday, former St. Louis Federal Reserve President James Bullard said he expects the Federal Reserve to start interest rate cuts before inflation drops to 2%.
He anticipates this could occur as early as March, with core inflation projected to slow to approximately 2% by October this year. This follows the Personal Consumption Expenditures (PCE) price index's decline to 2.6% in November 2023, year-on-year. The next PCE report is due this Friday.
Netflix rallied 4% in after-hours trading after its quarterly report release. Although earnings per share were $2.11, slightly below the anticipated $2.22, revenue exceeded expectations at $8.8 billion, surpassing the forecast of $8.72 billion. Subscriber growth also outperformed predictions.
The overall market sentiment in the US remains cautiously optimistic, as evidenced by investor reactions to recent earnings reports. The optimism is underpinned by a combination of diminishing inflation and the anticipated Federal Reserve's interest rate cuts, fuelling economic optimism.
However, there's a prevailing wariness among investors regarding whether these positive elements are already integrated into the high forward price-to-earnings ratios.
Be ready to trade the US Services PMI release today at 2:45 PM UK time. Analyst consensus expects the S&P Global Services PMI to come in at 51, slightly lower than the previous release. In December 2023, the S&P Global US Services PMI was adjusted to 51.4, indicating the strongest service sector growth in five months.
Summary of This Nasdaq 100 Technical Analysis Report:
- Nasdaq trades in a sizeable ascending trend channel with the channel top currently at 18,000. With the SMA 20 and SMA 50 pointing higher and the market trading well above the averages Nasdaq 100 technical analysis indicates strong momentum that could lead the technology index to the bull channel high.
- Nasdaq remains bullish above the major support level at 16,971 as it might attract renewed buying in the case of the market retracing back to it. Upside momentum is however so strong that such a strong retracement could be unlikely in which case we need to focus on key price levels in intraday charts.
- Nasdaq 100 technical analysis based on a flag formation suggests the market could have more upside ahead and might rally to 17,850 as long as the 17,286 support level isn't violated. Alternatively, below 17,286 we might see a retracement back to 17,130.
Read the full Nasdaq 100 technical analysis report below.
Nasdaq 100 Technical Analysis
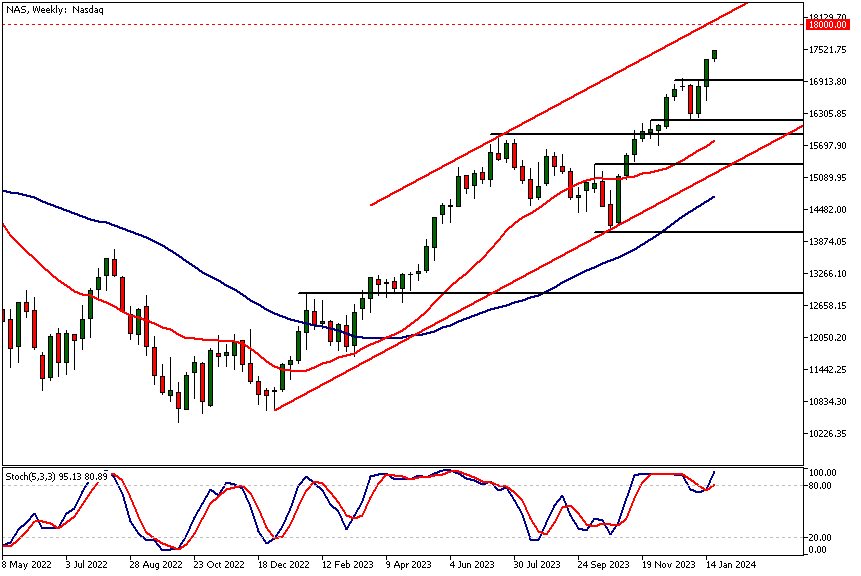
Weekly Nasdaq 100 Technical Analysis
Nasdaq trades in a sizeable ascending trend channel with the channel top currently at 18,000. With the SMA 20 and SMA 50 pointing higher and the market trading well above the averages Nasdaq 100 technical analysis indicates strong momentum that could lead the technology index to the bull channel high. Alternatively, should there be a retracement in the market the nearest key support level at 16,971 could come into play.
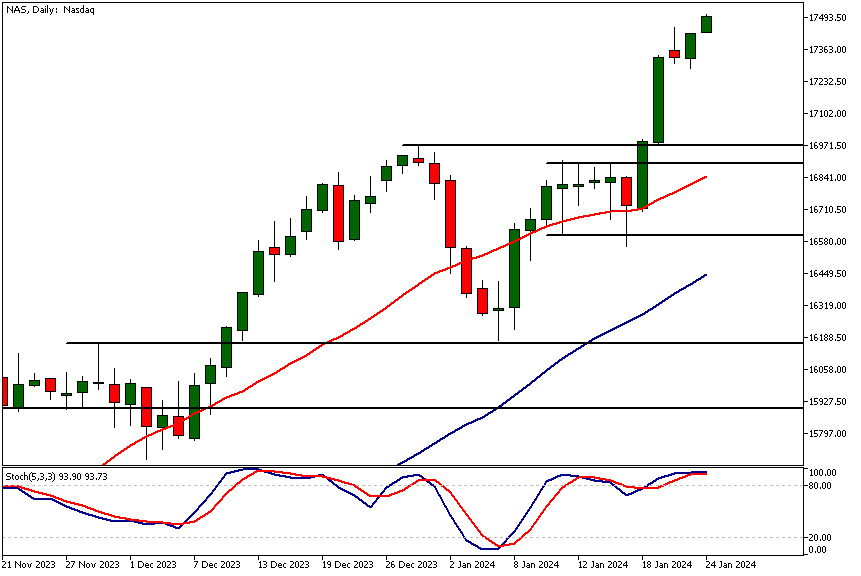
Daily Nasdaq 100 Technical Analysis
Nasdaq has rallied more than five per cent over the last five days. The market is very bullish with the moving averages pointing higher and the SMA 20 above the slower SMA 50. Nasdaq remains bullish above the major support level at 16,971 as it might attract renewed buying in the case of the market retracing back to it. Upside momentum is however so strong that such a strong retracement could be unlikely in which case we need to focus on key price levels in intraday charts.
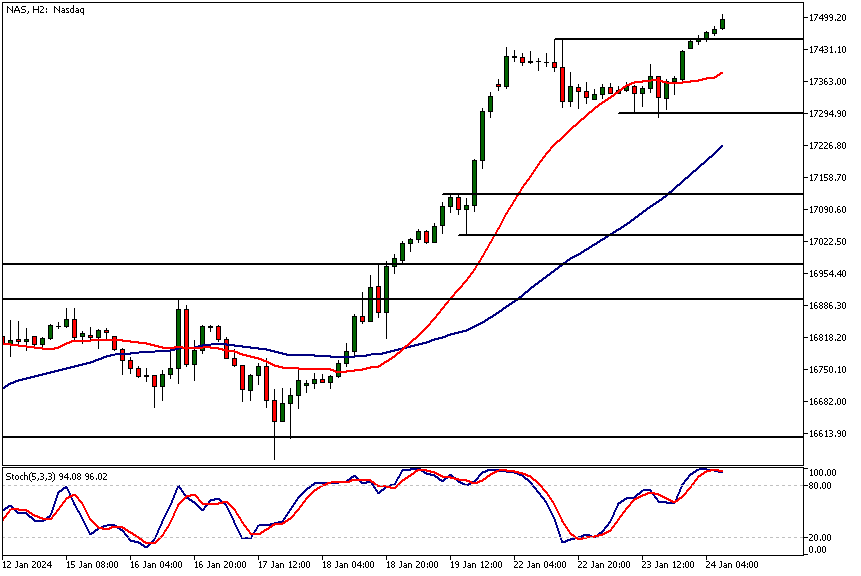
Intraday Nasdaq 100 Technical Analysis
The 8h chart shows how Nasdaq has created a flag formation and broken above it. In technical analysis, price formations are typically used as projection tools when traders gauge how far the market might move from a breakout point. These projections are called measured move projections.
Therefore, Nasdaq 100 technical analysis based on the flag formation suggests the market could have more upside ahead and might rally to 17,850 as long as the 17,286 support level isn't violated. Alternatively, below 17,286 we might see a retracement back to 17,130. Note, however, that the nearest support level is at 17,308. With both moving averages pointing higher levels like 17,308 are potential levels for the bulls to re-engage in the market after a pullback.
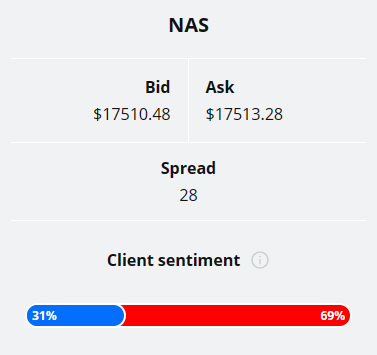
Client sentiment analysis
31% of clients trading Nasdaq are holding long positions, while 69% are holding short positions. Client sentiment data is being provided by TIO Markets Ltd.
Please note that retail client trading sentiment is often said to be a contrarian indicator. This is because trade data suggests that private (non-professional) traders, on average, trade against market price trends. You can follow the TIOmarkets client sentiment live on our Forex dashboard.
The next key risk events for this market
- USD - Flash Manufacturing PMI
- USD - Flash Services PMI
- USD - Advance GDP q/q
- USD - Unemployment Claims
- USD - Advance GDP Price Index q/q
- USD - Core Durable Goods Orders m/m
- USD - Durable Goods Orders m/m
- USD - New Home Sales
- USD - Core PCE Price Index m/m
- USD - Pending Home Sales m/m
Potential Nasdaq 100 Market Moves
Nasdaq technical analysis based on a flag formation suggests the market could have more upside ahead and might rally to 17,850 as long as the 17,286 support level isn't violated. Alternatively, below 17,286 we might see a retracement back to 17,130.

How Would You Trade The Nasdaq 100 Today?
I hope this Nasdaq 100 technical analysis helps you to make better informed trading decisions. Check the latest market analysis for other instruments and subscribe to receive them in your inbox as soon as they are published
DISCLAIMER: TIO Markets offers an exclusively execution-only service. The views expressed are for information purposes only. None of the content provided constitutes any form of investment advice. The comments are made available purely for educational and marketing purposes and do NOT constitute advice or investment recommendation (and should not be considered as such) and do not in any way constitute an invitation to acquire any financial instrument or product. TIOmarkets and its affiliates and consultants are not liable for any damages that may be caused by individual comments or statements by TIOmarkets analysis and assumes no liability with respect to the completeness and correctness of the content presented. The investor is solely responsible for the risk of his/her investment decisions. The analyses and comments presented do not include any consideration of your personal investment objectives, financial circumstances, or needs. The content has not been prepared in accordance with any legal requirements for financial analysis and must, therefore, be viewed by the reader as marketing information. TIOmarkets prohibits duplication or publication without explicit approval.

Janne Muta holds an M.Sc in finance and has over 20 years experience in analysing and trading the financial markets.
Related Posts


Trade responsibly: CFDs are complex instruments and come with a high risk of losing all your invested capital due to leverage.