Nasdaq 100 Technical Analysis | Investors turn cautious after the AI boom
BY Janne Muta
|January 3, 2024Nasdaq 100 Technical Analysis - Investors have been cautious with technology stocks lately. After a push higher due to the Fed's dovish turn in December, expectations of significant rate cuts have moderated, yet hopes for economic normalcy persist. The previous year's 50+ per cent rise in the Nasdaq Composite, driven largely by generative AI excitement, now faces a reality check with declines in tech stocks like Nvidia and Adobe.
The market anticipates almost three Fed rate cuts in early 2024, but strong Q4 GDP growth of 2.3% suggests a robust economy. Upcoming data, including the December jobs report, will be crucial in shaping the Nasdaq 100's direction. Investors remain cautiously optimistic, focusing on sustainable growth and the practical impact of AI in the tech sector, while keeping a close watch on economic stability and Fed policies.
Yesterday the T-Bond market traded lower sending the yields higher. This in turn weighed on the yield-sensitive Nasdaq 100 index resulting in a sizeable down day for the index. Nasdaq was the weakest of the main US equity indices in yesterday's trading and the technology sector (-2.5%) was the weakest of the S&P 500 sectors while utilities (+1.45%) rallied the most. The fact that a cyclical sector sells off while a safe-haven sector (utilities) rallies the most is a warning sign that the stock market as a whole could correct lower.
Summary of This Nasdaq 100 Technical Analysis Report:
- The Nasdaq reached new highs but showed a bearish shooting star candle above the previous all-time high of 16,767. Falling below 16,751 confirms bearish signals, targeting 16,170. If bulls take over, the index might rise to 16,890 and beyond. Long-term trends remain bullish, with moving averages and Stochastic Oscillator indicators.
- Breaking below the bull channel and a bearish wedge, Nasdaq targets 15,930, near a major weekly market structure level from last July. Currently at the SMA(20), a potential bounce back could lead to a return move to the channel low.
- Nasdaq trades below resistance at 16,547 and the SMA(50), signalling a bearish turn as it's below the slow and fast moving averages. Key support and resistance levels are at 16,165, 16,547, and 16,751, with the market's direction hinging on these crucial points.
Read the full Nasdaq 100 technical analysis report below.
Nasdaq 100 Technical Analysis

Weekly Nasdaq 100 Technical Analysis
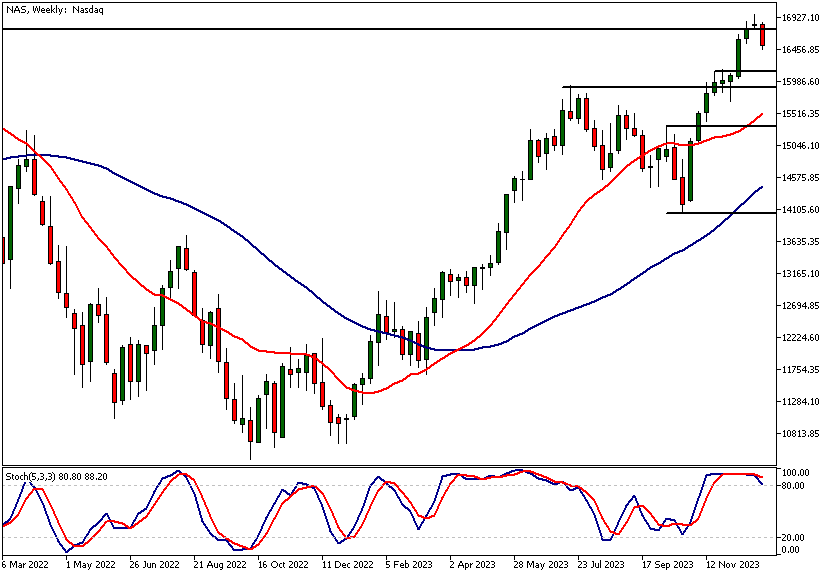
The market moved to new all-time highs two weeks ago and last week created a bearish rejection candle (a shooting star) above the previous ATH (at 16,767). Now the market has traded below the rejection candle low (16,751) confirming the bearish indications created by the shooting star candle.
Key price levels
Below 16,751, look for a move to 16,170 while above the level the market could move to 16,890 in the short-term and then perhaps to levels above the latest ATH price print at 16,971 if the bulls remain in charge. We need to monitor the smaller timeframe charts to see how the price action develops in order to define what's the most likely alternative.
Indicator-based Nasdaq technical analysis suggests the long-term trend is still bullish as the moving averages point higher and the fast SMA(20) is above the slow SMA(50). Stochastic Oscillator has given a sell signal with the Stochastic line crossing below the signal line.

Daily Nasdaq 100 Technical Analysis
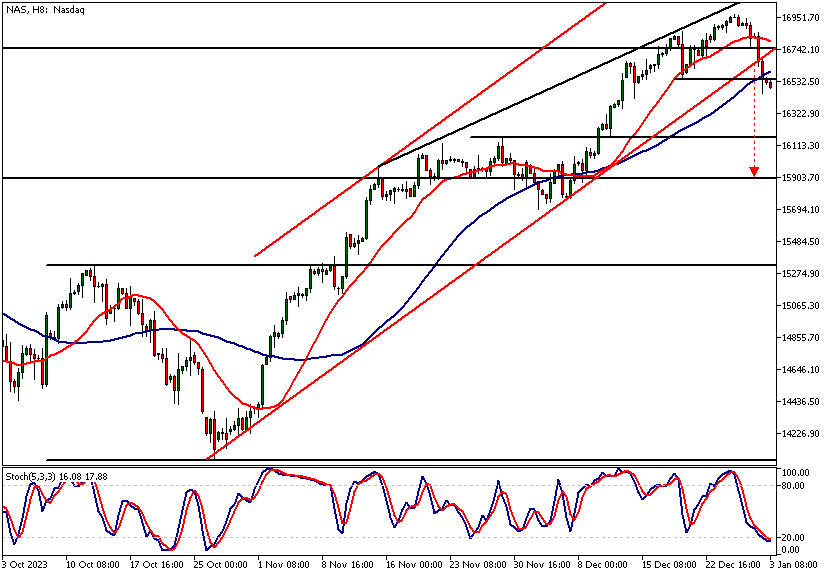
Nasdaq has broken below the bull channel low which also was the low of a bearish wedge formation. A measured move target based on the width of the formation suggests the market could move down to 15,930, a level that is a major weekly market structure level that was created in July last year. The level is between the rising moving averages and as such could be a level that might attract buyers.
Currently, the market is trading at the SMA(20) and if that's enough to bounce the market higher we could see Nasdaq creating a return move to the channel low which roughly coincides with the old ATH level (16,767) we referred to in the weekly Nasdaq technical analysis section.

Intraday Nasdaq 100 Technical Analysis
The 8h chart shows Nasdaq trading below a resistance level (16,547) and the SMA(50). As per moving average-based Nasdaq technical analysis the market is now turning bearish as it trades below the slow moving average (50-periods) and the fast SMA (20-periods) is contracting. The nearest key support and resistance levels are 16,165, 16,547 and 16,751.

Client sentiment analysis
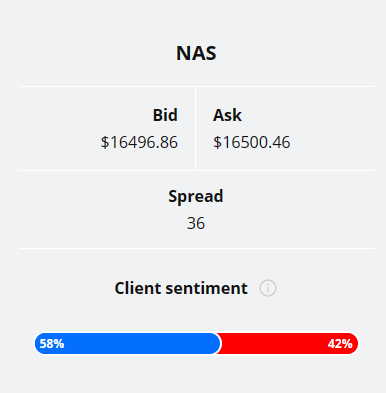
58% of clients trading Nasdaq are holding long positions, while 42% are holding short positions. Client sentiment data is being provided by TIO Markets Ltd.
It’s good to remember that retail client trading sentiment is a contrarian indicator as most retail traders are on average trading against market price trends. This is why experienced traders tend to trade against the retail client sentiment. You can follow the TIOmarkets client sentiment live on our Forex dashboard.
The next key risk events for this market
- FOMC Member Barkin Speaks
- ISM Manufacturing PMI
- JOLTS Job Openings
- ISM Manufacturing Prices
- FOMC Meeting Minutes
- German Prelim CPI m/m
- ADP Non-Farm Employment Change
- Unemployment Claims
- Construction PMI
- Core CPI Flash Estimate y/y
- CPI Flash Estimate y/y
- Average Hourly Earnings m/m
- Non-Farm Employment Change
- ISM Services PMI
- FOMC Member Barkin Speaks

Potential Nasdaq 100 Market Moves
The bearish outlook sees the Nasdaq descending towards 16,170 if the index stays below 16,751. Weekly bearish candle pattern and a breakdown from bearish wedge formations suggest this decline in price could take place. The bearish wedge formation on the daily chart points to a further drop to 15,930.
In the bullish scenario, the Nasdaq could rebound from current levels, surpassing 16,751 and aiming for a short-term target of 16,890, with potential to breach the recent all-time high of 16,971.
How Would You Trade The Nasdaq 100 Today?
I hope this Nasdaq 100 technical analysis helps you to make better informed trading decisions. Check the latest market analysis for other instruments and subscribe to receive them in your inbox as soon as they are published
DISCLAIMER: TIO Markets offers an exclusively execution-only service. The views expressed are for information purposes only. None of the content provided constitutes any form of investment advice. The comments are made available purely for educational and marketing purposes and do NOT constitute advice or investment recommendation (and should not be considered as such) and do not in any way constitute an invitation to acquire any financial instrument or product. TIOmarkets and its affiliates and consultants are not liable for any damages that may be caused by individual comments or statements by TIOmarkets analysis and assumes no liability with respect to the completeness and correctness of the content presented. The investor is solely responsible for the risk of his/her investment decisions. The analyses and comments presented do not include any consideration of your personal investment objectives, financial circumstances, or needs. The content has not been prepared in accordance with any legal requirements for financial analysis and must, therefore, be viewed by the reader as marketing information. TIOmarkets prohibits duplication or publication without explicit approval.
Join us on social media

Janne Muta holds an M.Sc in finance and has over 20 years experience in analysing and trading the financial markets.
Related Posts
Trade responsibly: CFDs are complex instruments and come with a high risk of losing all your invested capital due to leverage.


