Nasdaq 100 Technical Analysis | Is the potentially softer CPI already priced in?
BY Janne Muta
|December 12, 2023Nasdaq 100 Technical Analysis - The Nasdaq has rallied significantly, with gains of over 15% since its October low. The release of key inflation data, including the November consumer-price index (CPI) and supplier-level price updates are due today and tomorrow.
These are likely to influence expectations for the Federal Reserve's policy for the coming year. Amid trends of declining inflation, investors are speculating about the possibility of the Fed initiating rate cuts as early as May.
The US is experiencing a faster-than-expected easing of price pressures. While the headline CPI is expected to remain unchanged for the second month, the core rate is slightly firmer, with forecasts predicting a modest increase.
November's US Core Year-on-Year CPI is expected to remain at 4%, mirroring the October figure. The month-on-month Core CPI is forecasted to show a slight increase to 0.3% from October's 0.2%. The annual inflation rate is predicted to decrease marginally to 3.1% in November, down from October's 3.2%, largely due to falling energy costs.
Insights from October's Producer Price Index (PPI) indicate a potential moderation in consumer prices, with a notable decrease in goods prices, including a 15.3% drop in gasoline prices. However, the unchanged Core PPI suggests stability in other sectors.
Analysts predict a steady Core CPI year-over-year at 4%, and a minor uptick in month-over-month figures, suggesting that while inflation persists, it's not accelerating rapidly. This outlook presents a cautiously optimistic scenario where inflationary pressures are sustained but not worsening at an alarming rate.
Softer than expected inflation readings would are expected to support equities while higher than expected readings might trigger a retracement in the rate sensitive Nasdaq index. However, the question is whether the potentially softer CPI is already priced in after a 15% rally.
Summary of This Nasdaq 100 Technical Analysis Report:
- NASDAQ continues to rally for the 7th consecutive week, advancing over 15% percent since the October low. There have been no down weeks, as every Friday the index has closed above its opening level on Monday.
- The latest upward leg in this bullish trend has propelled NASDAQ by 3.5%, after attracting buyers at 15,691. Note that the market is trading close to the 16,309 resistance level identified in the weekly NASDAQ 100 technical analysis.
- The 4-hour chart shows NASDAQ losing upside momentum over the last two or three price candles. This could be a temporary pause before the market continues to rally, but there is also a risk of this sideways movement turning into a retracement.
Read the full Nasdaq 100 technical analysis report below.
Nasdaq 100 Technical Analysis

Weekly Nasdaq 100 Technical Analysis
NASDAQ continues to rally for the 7th consecutive week, advancing over 15% percent since the October low. There have been no down weeks, as every Friday the index has closed above its opening level on Monday.
Last week, NASDAQ experienced a downward move, but this was quickly reversed, resulting in a bullish rejection candle. This week, the market has continued this bullish trend, reaching new year-to-date (YTD) highs.
Key resistance level
The nearest key resistance level is at 16,309, a peak established in December 2021 just before a major bearish reversal in technology stocks. Alternatively, if the market decisively breaks below 15,691, a decline to 15,340 could be likely.
Based on NASDAQ 100 technical analysis, the market remains bullish as the 20-period moving average is well above the 50-period SMA, and both averages are trending upward. Note that the market is currently trading significantly above the 20-period moving average. Simultaneously, the stochastic oscillator is in the overbought area, having been above the 80 threshold for the last four weeks.
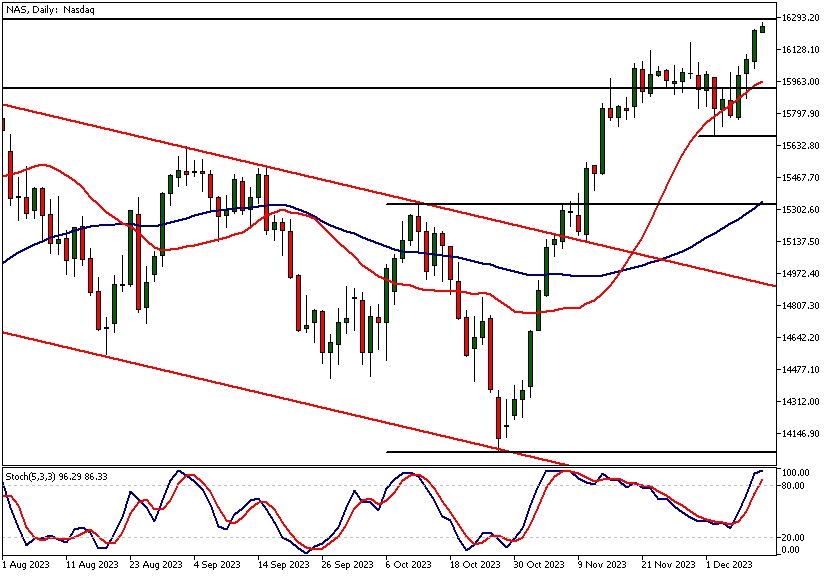
Daily Nasdaq 100 Technical Analysis
The latest upward leg in this bullish trend has propelled NASDAQ by 3.5%, after attracting buyers at 15,691. Note that the market is trading close to the 16,309 resistance level identified in the weekly NASDAQ 100 technical analysis. If the market can push decisively above this level, traders might target the 2021 high of 16,767. Alternatively, if there is substantial supply around 16,309, a retracement back to around 16,010 could be likely.
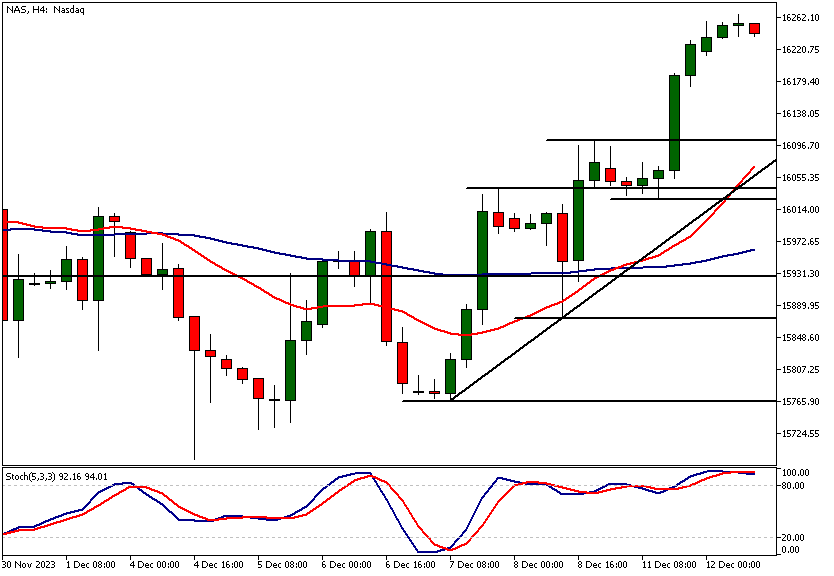
Nasdaq 100 Technical Analysis, 4h Chart
The 4-hour chart shows NASDAQ losing upside momentum over the last two or three price candles. This could be a temporary pause before the market continues to rally, but there is also a risk of this sideways movement turning into a retracement.
Should the market retrace, it's important to identify key support levels. NASDAQ 100 technical analysis shows the nearest notable support is at 16,101, and below this, there is a confluence area where a rising trend line, two market structure levels (16,028.70 and 16,042.33), and the 20-period moving average meet. In the event of a market retracement to these levels, traders should monitor price action on shorter time frame charts to see if renewed buying occurs.
Rate sensitive equity index
As NASDAQ is highly sensitive to interest rates and therefore to inflation (one of the Federal Reserve's policy drivers), today's inflation data release could cause enough market fluctuation to test this technical confluence area. Alternatively, if the CPI numbers are much lower than expected, this could attract new buying into the technology-heavy Nasdaq index.
The next key risk events for this market
- USD - Core CPI
- USD - CPI
- USD - PPI and Core PPI
- USD - Federal Funds Rate
- USD - FOMC Economic Projections
- USD - FOMC Statement
- USD - FOMC Press Conference
- USD - Retail Sales and Core Retail Sales
- USD - Unemployment Claims
- USD - Empire State Manufacturing Index
- USD - Industrial Production
- USD - Flash Manufacturing PMI
- USD - Flash Services PMI

Potential Nasdaq 100 Market Moves
The nearest key resistance level is at 16,309, a peak established in December 2021 just before a major bearish reversal in technology stocks. Alternatively, if the market decisively breaks below 15,691, a decline to 15,340 could be likely.
How Would You Trade The Nasdaq 100 Today?
I hope this Nasdaq 100 technical analysis helps you to make better informed trading decisions. Check the latest market analysis for other instruments and subscribe to receive them in your inbox as soon as they are published
DISCLAIMER: TIO Markets offers an exclusively execution-only service. The views expressed are for information purposes only. None of the content provided constitutes any form of investment advice. The comments are made available purely for educational and marketing purposes and do NOT constitute advice or investment recommendation (and should not be considered as such) and do not in any way constitute an invitation to acquire any financial instrument or product. TIOmarkets and its affiliates and consultants are not liable for any damages that may be caused by individual comments or statements by TIOmarkets analysis and assumes no liability with respect to the completeness and correctness of the content presented. The investor is solely responsible for the risk of his/her investment decisions. The analyses and comments presented do not include any consideration of your personal investment objectives, financial circumstances, or needs. The content has not been prepared in accordance with any legal requirements for financial analysis and must, therefore, be viewed by the reader as marketing information. TIOmarkets prohibits duplication or publication without explicit approval.

Janne Muta holds an M.Sc in finance and has over 20 years experience in analysing and trading the financial markets.
Related Posts


Trade responsibly: CFDs are complex instruments and come with a high risk of losing all your invested capital due to leverage.