Nasdaq 100 technical analysis | Lower Inflation Without Recession?
BY Janne Muta
|November 6, 2023Nasdaq Technical Analysis - Nasdaq has rallied strongly with the rest of the US stock market as the Federal Reserve's interest rate hikes seem to be having the intended effect of tempering inflation without pushing the economy into a recession. According to WSJ, there is now a 95% probability that the Fed will maintain current rates in December, which is up from 79% a week prior.
There has been a significant drop in the yield on the U.S. 10-year Treasury note, which has further strengthened technology stocks. Lower bond yields relieve pressure on stocks, as higher yields make borrowing more expensive and risk-free returns more attractive compared to equities.
Summary of This Nasdaq 100 Technical Analysis Report:
- Nasdaq rallied to the weekly bear channel high after testing the channel low two weeks ago. As a result, the market is trading near the 61.8% Fibonacci retracement level (at 15,210) and is approaching a key resistance level at 15,336.
- The 4h chart reveals two confluence areas below the current market price. The nearest can be found at 14,853 - 14,933 range and consists of two market structure levels, the 23.6% Fibonacci retracement level and the SMA(20).
- The Federal Reserve's interest rate hikes seem to be having the intended effect of tempering inflation without pushing the economy into a recession.
Read the full Nasdaq 100 technical analysis report below.
Nasdaq 100 Technical Analysis
Weekly Nasdaq 100 Technical Analysis
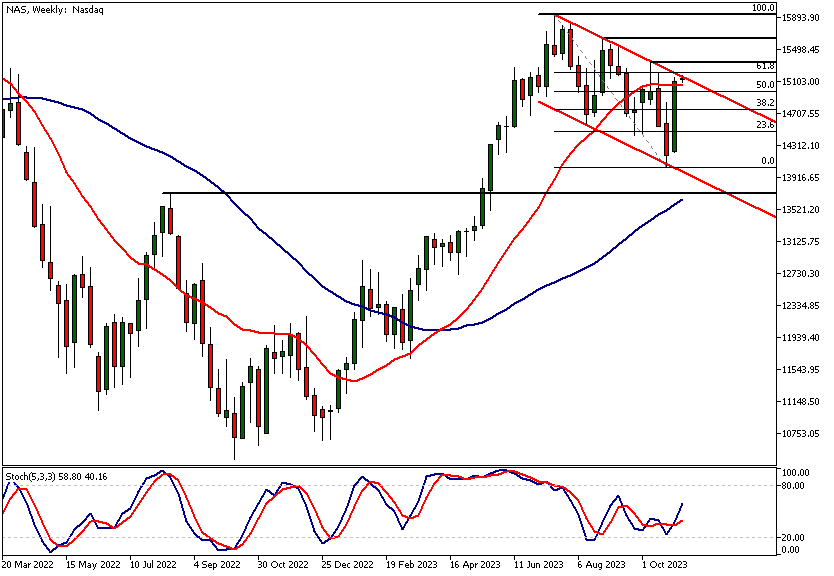
Nasdaq rallied to the weekly bear channel high after testing the channel low two weeks ago. As a result, the market is trading near the 61.8% Fibonacci retracement level (at 15,210) and is approaching a key resistance level at 15,336.
Strong Rally
While the rally was strong we might see some of the market operators taking profits, which could lead to the rally slowing down. If the market cannot penetrate the 15,336 market structure level, Nasdaq could trade down to 14,800 or so.
Our Nasdaq 100 technical analysis suggests that above the 15,336 a move to 15,520 could be likely. While the market is still trading inside a bearish trend channel, bullish moving averages and the strong rally last week indicate the market is gaining strength.
Daily Nasdaq 100 Technical Analysis
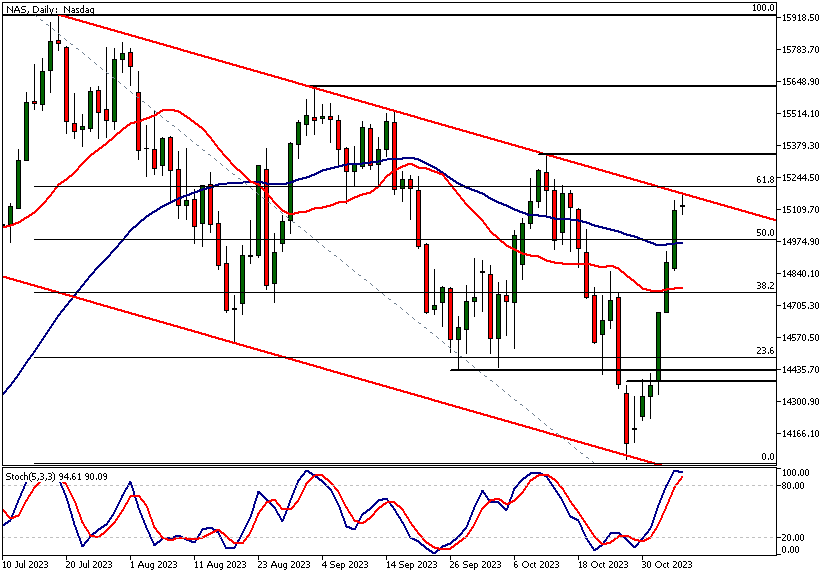
The daily chart shows the market trading at the channel high with the stochastic oscillator in the overbought area. There are no technical support levels above the 14,392 - 14,443 area, testifying to the strength of last week's rally.
Therefore the daily timeframe chart provides fairly similar reading to the weekly chart, which is rare. Usually, the daily timeframe charts provide a more nuanced picture with several technical factors the market operators could focus on.
Nasdaq 100 Technical Analysis, 4h Chart
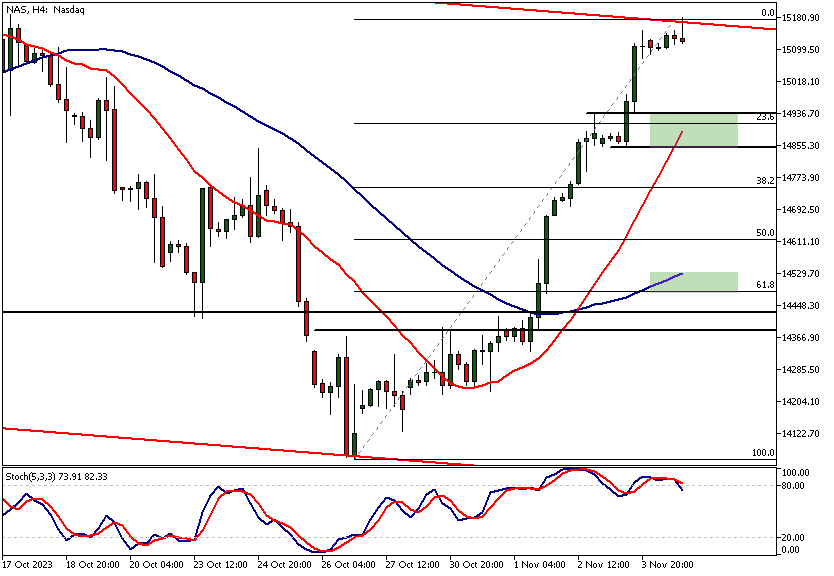
The 4h chart reveals two confluence areas below the current market price. The nearest can be found at 14,853 - 14,933 range and consists of two market structure levels, the 23.6% Fibonacci retracement level and the SMA(20).
Potential Retracement
Should there be a retracement and this level fails to attract buyers, the bears could be targeting the next confluence area at 14,478 - 14,530. This is where the SMA(50) and the 61.8% retracement level are somewhat roughly aligned within this price range.
Client sentiment analysis
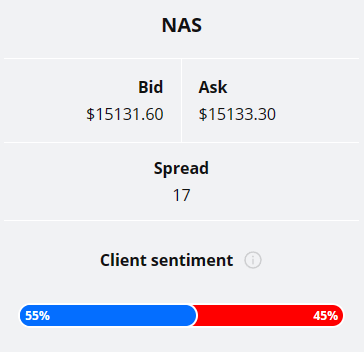
TIOmarkets' clientele positioning doesn't give strong indication on either direction with 55% of the client base long and 45% short.
Please remember that the retail trader client sentiment is a contrarian indicator as most of the retail traders are on average betting against the market trends. This is why, experienced traders tend to trade against the retail client sentiment. You can follow the TIOmarkets client sentiment live on our Forex dashboard.
- The next key risk events impacting this market:
- FOMC Member Waller Speaks
- Fed Chair Powell Speaks
- Unemployment Claims
- Prelim UoM Consumer Sentiment
- Prelim UoM Inflation Expectations

Potential Nasdaq 100 Market Moves
The Nasdaq's surge to the weekly bear channel high, coinciding with a key Fibonacci level, signals bullish momentum. With sustained trading above 15,336, a move to 15,520 looks possible.
Despite recent gains, Nasdaq's struggle to breach 15,336 could incite profit-taking, risking a slide to 14,800.
How would you trade the Nasdaq 100 today?
I hope this fundamental analysis and Nasdaq 100 technical analysis helps you to make better informed trading decisions. Check the latest market analysis for other instruments and subscribe to receive them in your inbox as soon as they are published
DISCLAIMER: TIO Markets offers an exclusively execution-only service. The views expressed are for information purposes only. None of the content provided constitutes any form of investment advice. The comments are made available purely for educational and marketing purposes and do NOT constitute advice or investment recommendation (and should not be considered as such) and do not in any way constitute an invitation to acquire any financial instrument or product. TIOmarkets and its affiliates and consultants are not liable for any damages that may be caused by individual comments or statements by TIOmarkets analysis and assumes no liability with respect to the completeness and correctness of the content presented. The investor is solely responsible for the risk of his/her investment decisions. The analyses and comments presented do not include any consideration of your personal investment objectives, financial circumstances, or needs. The content has not been prepared in accordance with any legal requirements for financial analysis and must, therefore, be viewed by the reader as marketing information. TIOmarkets prohibits duplication or publication without explicit approval.

Janne Muta holds an M.Sc in finance and has over 20 years experience in analysing and trading the financial markets.
Related Posts


Trade responsibly: CFDs are complex instruments and come with a high risk of losing all your invested capital due to leverage.