Nasdaq 100 Technical Analysis | Technology stocks soar after lower CPI
BY Janne Muta
|November 15, 2023Nasdaq Technical Analysis - The lower-than-expected pace of core inflation convinced the markets the Federal Reserve would not continue hiking rates. As a result, futures traders now price in four rate hikes for the next year. Stocks, commodities and commodity currencies across the board rallied hard with the rate-sensitive Nasdaq rallying 2.2%.
The ratio of rising issues to decliners in the Nasdaq exchange was as high as 3.55 with only 952 stocks declining. In the S&P 500 index, all 11 sectors rallied higher with the rate-sensitive real estate sector (5.4%) leading the gains.
Today's retail sales, an important indicator of both inflation and the health of the US economy will be followed closely by traders. Retail sales have so far remained strong in H2 2023 with a rise of 0.7% m/m in September 2023 and following an upwardly revised 0.8% rise in August. However, the analyst consensus predicts a significant slowdown of 0.3% to be reported today.
Summary of This Nasdaq 100 Technical Analysis Report:
- Our Nasdaq 100 technical analysis indicates that if the market can continue to push higher and attract buyers above 15,932, we could see the market moving to 16,250. Alternatively, a failure to push decidedly above the YTD high could see a move to 15,533 as likely.
- Nasdaq near the bullish trend channel's upper end in the 8-hour chart, is overbought but remains strong. A corrective move might attract buyers, while continued momentum could challenge the YTD high of 15,932.
Read the full Nasdaq 100 technical analysis report below.
Nasdaq 100 Technical Analysis
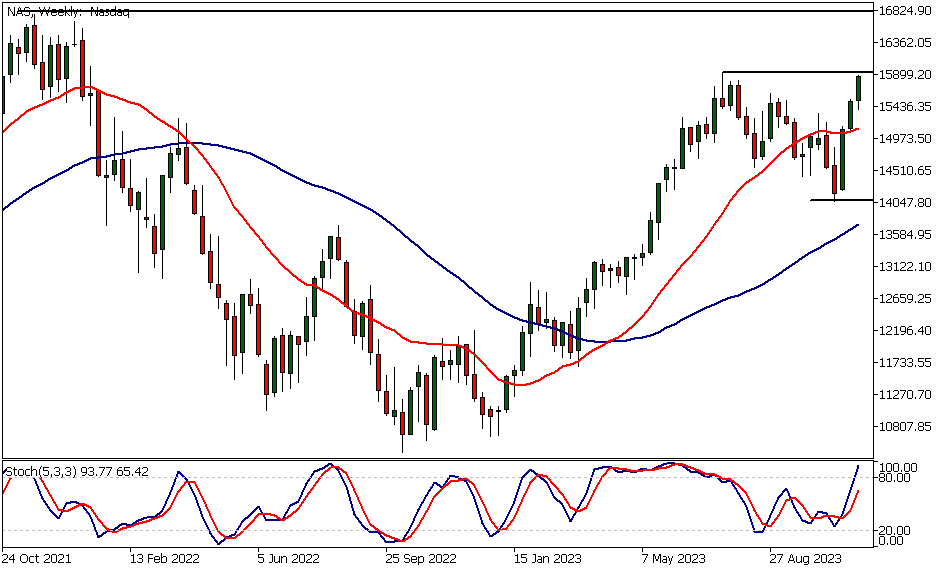
Weekly Nasdaq 100 Technical Analysis
The Nasdaq has rallied to levels near the YTD high (15,932). The rally has been powered by declining yields as the market expectations of Fed rate cuts for the next year have increased.
With a market approaching the yearly high, we should be cautious in case the market participants take profits close to this key market area. Our Nasdaq 100 technical analysis indicates that if the market can continue to push higher and attract buyers above 15,932, we could see the Nasdaq moving to 16,250.
Alternatively, a failure to push decidedly above the YTD high could see a move to 15,533 as likely.
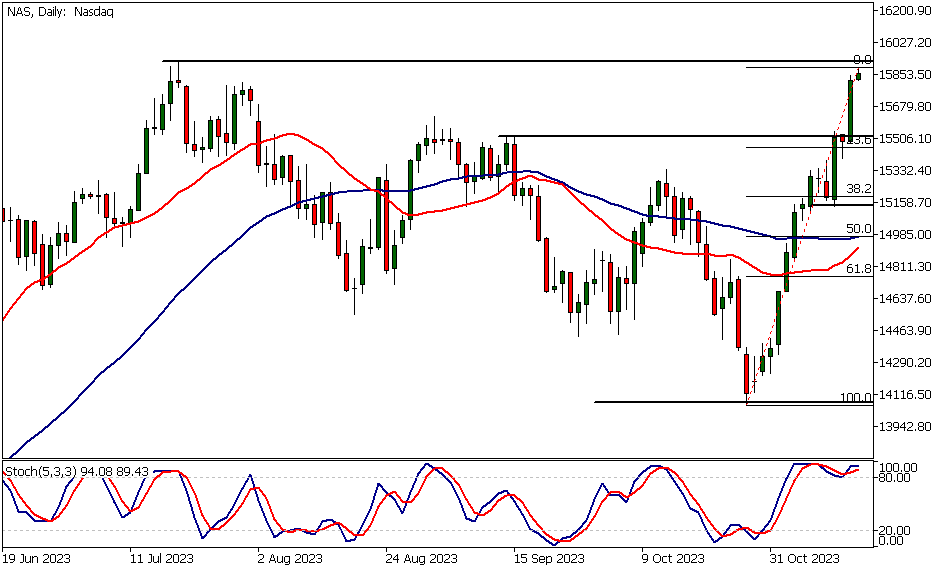
Daily Nasdaq 100 Technical Analysis
The daily chart reveals two market structure levels potentially supporting the market (attracting buyers) should there be a retracement down to these levels. The nearest level at 15,512 is somewhat closely aligned with the 23.6% Fibonacci retracement level. Our Nasdaq 100 technical analysis indicates that it adds to the significance of this price level.
The next key support level is at 15,138, and this level is also fairly closely aligned with a Fibonacci retracement level. The 38.2% Fibonacci level is only approximately 60 points above this support level.
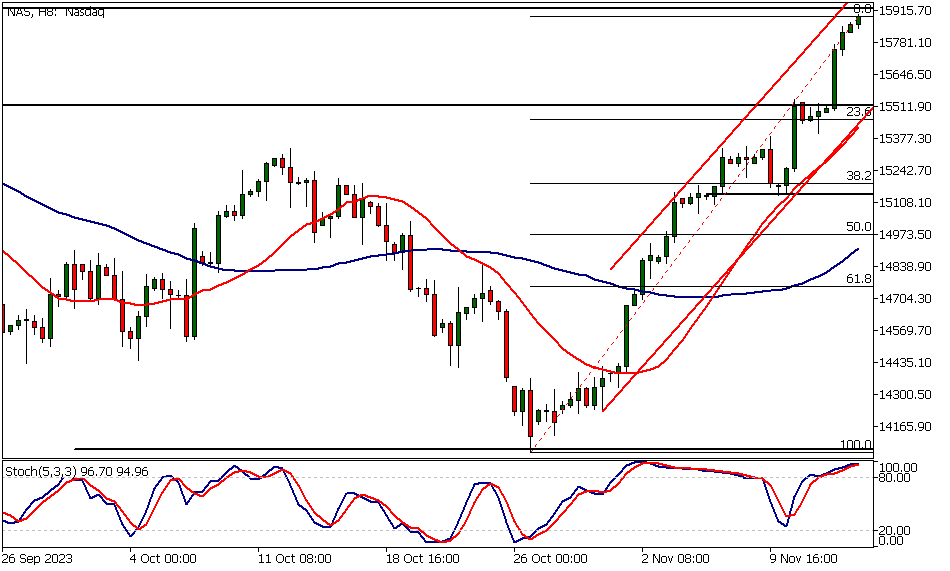
Nasdaq 100 Technical Analysis, 4h Chart
In the 8-hour chart, NASDAQ trades fairly close to the upper end of a bullish trend channel high. The market is overbought as per the stochastic oscillator, but it's worth noting that the indicator has been in the overbought area for extended periods during this strong up move. This indication, therefore, on its own is not a reason to short the market.
However, if there is a corrective move to the confluence area (the market structure level, the 23.6% Fibonacci retracement level, and the bull channel low), we might see buyers stepping in again.
On the other hand, as Nasdaq 100 technical analysis shows the momentum has been strong lately and the market participants are pricing in four rate cuts for the coming year. Therefore, the market might rally further.
Then the question is whether there is sufficient demand above the YTD high (15,932) to keep the momentum going. To ascertain this traders need to rely on price action analysis once the market has moved beyond the current yearly high.
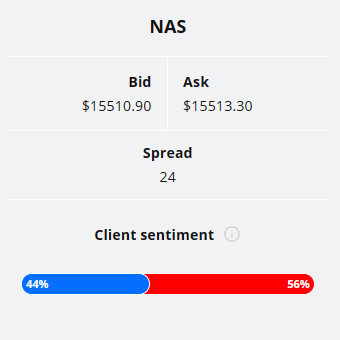
Client sentiment analysis
TIOmarkets' clientele positioning doesn't give strong indication on either direction with 56% of the client base short and 44% short.
Please remember that the retail trader client sentiment is a contrarian indicator as most of the retail traders are on average betting against the market trends. This is why, experienced traders tend to trade against the retail client sentiment. You can follow the TIOmarkets client sentiment live on our Forex dashboard.
The next key risk events for this market
- PPI
- Retail Sales
- Empire State Manufacturing Index
- Unemployment Claims
- Philly Fed Manufacturing Index
- Industrial Production
- Building Permits

Potential Nasdaq 100 Market Moves
Our Nasdaq 100 technical analysis indicates that if the market can continue to push higher and attract buyers above 15,932, we could see the market moving to 16,250. Alternatively, a failure to push decidedly above the YTD high could see a move to 15,533 as likely.
How would you trade the Nasdaq 100 today?
I hope this Nasdaq 100 technical analysis helps you to make better informed trading decisions. Check the latest market analysis for other instruments and subscribe to receive them in your inbox as soon as they are published
DISCLAIMER: TIO Markets offers an exclusively execution-only service. The views expressed are for information purposes only. None of the content provided constitutes any form of investment advice. The comments are made available purely for educational and marketing purposes and do NOT constitute advice or investment recommendation (and should not be considered as such) and do not in any way constitute an invitation to acquire any financial instrument or product. TIOmarkets and its affiliates and consultants are not liable for any damages that may be caused by individual comments or statements by TIOmarkets analysis and assumes no liability with respect to the completeness and correctness of the content presented. The investor is solely responsible for the risk of his/her investment decisions. The analyses and comments presented do not include any consideration of your personal investment objectives, financial circumstances, or needs. The content has not been prepared in accordance with any legal requirements for financial analysis and must, therefore, be viewed by the reader as marketing information. TIOmarkets prohibits duplication or publication without explicit approval.

Janne Muta holds an M.Sc in finance and has over 20 years experience in analysing and trading the financial markets.
Related Posts


Trade responsibly: CFDs are complex instruments and come with a high risk of losing all your invested capital due to leverage.