Natural Gas Technical Analysis | Shooting Star in the Daily Chart
BY Janne Muta
|October 30, 2023Natural gas technical analysis - The Natgas prices have fluctuated substantially recently. The surge in global demand, due to the post-COVID-19 recovery, a shift away from oil, and the Ukraine conflict, have all played a major role in the recent price action.
As economies rebound, businesses and consumers have escalated their gas consumption. Also, transitioning from coal and oil to natural gas for environmental considerations has created demand pushing the price higher.
On the supply side, constraints have emerged from unexpected maintenance at production sites, pipeline disruptions, and extreme weather. For example, a fire at Freeport LNG, one of the largest LNG export facilities in the United States, has reduced US LNG exports.
Summary of this Natural Gas technical analysis report
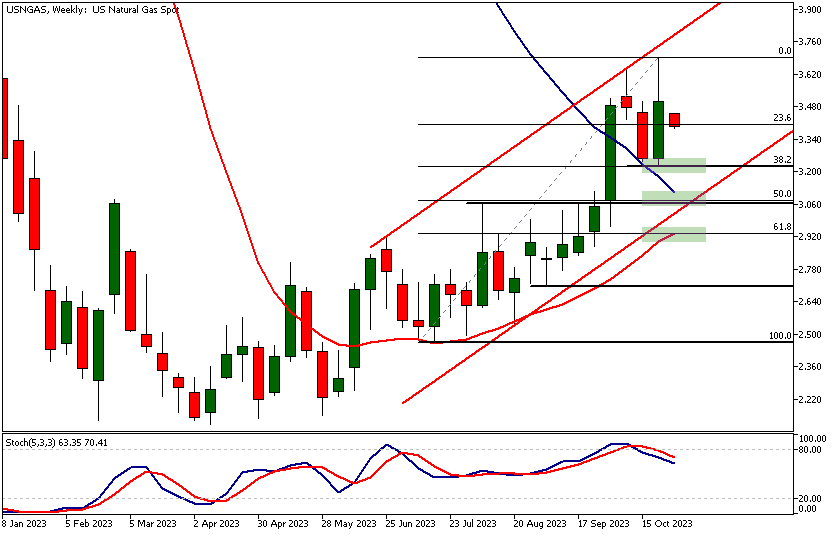
- Natural gas is in an uptrend, rallying 75% since April, then retracing 8.3%. Volatility rose with oil's instability after the Israel-Hamas conflict. Key supports are at 3.223 and 3.060-3.1108. If sustained, the market may retest 3.688.
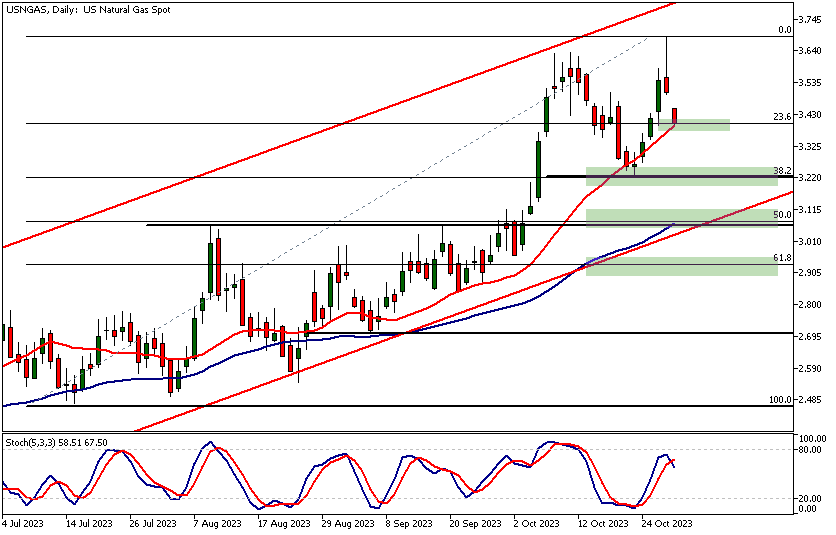
- Yesterday's bearish shooting star candle led to a market decline, reaching the 23.6% Fibonacci retracement and 20-period moving average. The October 11th high faced resistance at 3.635. Key supports are at 3.223 and the crucial 3.06 level aligning with several technical indicators.
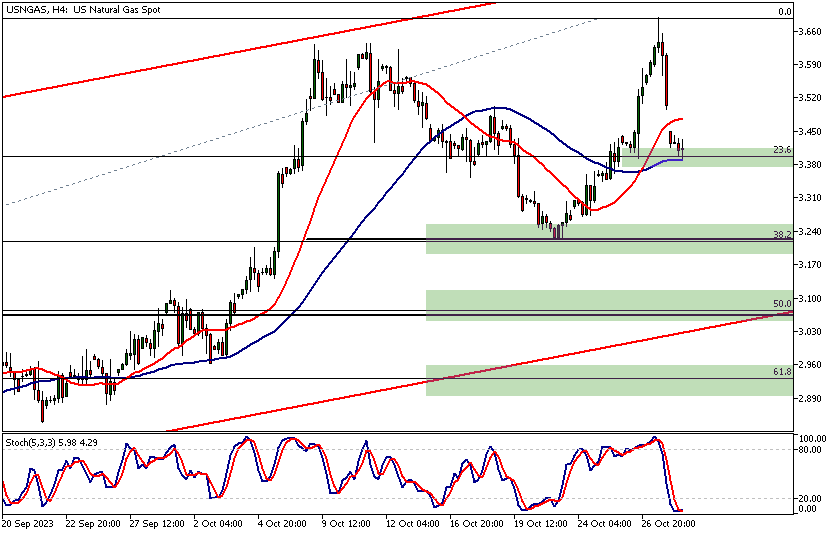
- The 4-hour chart mirrors the daily, with the market at the 23.6% Fibonacci retracement level (3.393), aligning with the 50-period moving average. The oversold stochastic oscillator suggests potential support, but strong downward momentum may target the 3.225 level, the 38.2% retracement.
Read our full Natural Gas technical analysis report below.
Natural Gas Technical Analysis

Natural Gas Technical Analysis, Weekly
The weekly chart of natural gas shows the market in an uptrend. The market has rallied about 75% since the April low before retracing lower by 8.3% from last week's high. Volatility has increased significantly since the beginning of October. Our natural gas technical analysis shows this to be the same period during which the price of oil has see-sawed up and down following the Hamas terrorist attack on Israel and the ensuing war between Israel and Hamas.
Key Support Area Noted
The nearest key support area is last week's low at 3.223. Note that this level coincides with the 38.2% Fibonacci retracement level, making it a technical confluence level to which we should pay attention.
Further Levels of Interest
If the level doesn't hold, the next confluence area to focus on can be found at 3.060 - 3.1108. The 50% Fibonacci retracement level and the bull channel low are closely aligned with the 50-period SMA inside this range. This is a key area for the market to sustain the current uptrend. Should there be a decisive close below 3.060, the market could be trading to 2.933 and perhaps even deeper to the downside, as this would be considered a trend reversal.
Potential Retest of Highs
If the price levels around the 50% Fibonacci retracement level attract buyers and there is follow-through buying, then we might see the market retesting the October high at 3.688.

Natural Gas Technical Analysis, Daily
The bearish shooting star candle created in yesterday's trading caused the market to gap lower and continue sliding in today's trading. The market has reached the 23.6% Fibonacci retracement level, which is closely aligned with the 20-period moving average. This confluence area has slowed down the decline, but it could be temporary.
Analyzing Recent Market Rally
The long spike above the candle body yesterday signals that the market wasn't able to attract more buying above the October 11th high. Instead, the rally failed due to substantial resistance above the high (3.635).
Identifying Key Support Areas
The nearest key support level is the swing low at 3.223, which contains the 38.2% retracement level and some technical levels. As mentioned in the weekly natural gas technical analysis above, the most important support area for this current uptrend can be found around the 50% retracement level. This level coincides with a market structure level at 3.06, the 50-period moving average, and the rising bull channel low.

Natural Gas Technical Analysis, 4h
The 4-hour chart provides us with a fairly similar technical picture as the daily chart. After gapping lower, the market is trading at the 23.6% Fibonacci retracement level (at 3.393), which in this timeframe is closely aligned with the 50-period moving average.
Oscillator and Support Levels
The stochastic oscillator is oversold in the four-hour timeframe, but as we pointed out in the daily natural gas technical analysis above, the lack of buying interest above the October 11th high and the ensuing strong downward move indicate that this support could eventually be broken. This would pave the way to the next support area around the 38.2% Fibonacci retracement level at 3.225.
The Next Key Risk Events
- FOMC rate decision
- U.S. ISM Manufacturing PMI
- Natural gas inventory report

Potential Natural Gas market moves
Despite the recent retracement, the natural gas market remains in a strong uptrend from its April lows. The convergence of key support levels, particularly around the 38.2% and 50% Fibonacci retracement levels, combined with the 50-period SMA and bull channel low, suggests a solid foundation for potential rebounds. If buyers step in around these critical zones, a retest of the October high at 3.688 is plausible, pointing to continued upward momentum.
Alternatively, the bearish shooting star candle and subsequent gap down signal a potential shift in market sentiment. The failure to sustain buying interest above the October 11th high, coupled with the increased volatility since October, may be early warning signs. If the market breaks decisively below the critical support at 3.060, it could pave the way to 2.933 or lower, indicating a possible trend reversal and more extended downside potential.
How would you trade Natural Gas today?
I hope this fundamental and technical Natural Gas analysis helps you to make better informed trading decisions. Check the latest market analysis for other instruments and subscribe to receive them in your inbox as soon as they are published
DISCLAIMER: TIO Markets offers an exclusively execution-only service. The views expressed are for information purposes only. None of the content provided constitutes any form of investment advice. The comments are made available purely for educational and marketing purposes and do NOT constitute advice or investment recommendation (and should not be considered as such) and do not in any way constitute an invitation to acquire any financial instrument or product. TIOmarkets and its affiliates and consultants are not liable for any damages that may be caused by individual comments or statements by TIOmarkets analysis and assumes no liability with respect to the completeness and correctness of the content presented. The investor is solely responsible for the risk of his/her investment decisions. The analyses and comments presented do not include any consideration of your personal investment objectives, financial circumstances, or needs. The content has not been prepared in accordance with any legal requirements for financial analysis and must, therefore, be viewed by the reader as marketing information. TIOmarkets prohibits duplication or publication without explicit approval.
Join us on social media

Janne Muta holds an M.Sc in finance and has over 20 years experience in analysing and trading the financial markets.
Related Posts
Trade responsibly: CFDs are complex instruments and come with a high risk of losing all your invested capital due to leverage.


