Natural Gas Technical Analysis | EIA forecasts growth in natural gas supply
BY Janne Muta
|January 11, 2024Natural gas technical analysis - The US Energy Information Administration (EIA) forecasts for the natural gas market indicates a balance shift in supply and demand. The supply, encompassing production and imports, is predicted to increase by over 1 Bcf/d. Meanwhile, the demand, including domestic use and exports, is expected to rise by nearly 2 Bcf/d, primarily driven by an increase in exports.
Starting the year, the US had 14% more natural gas in storage compared to the five-year average. Though demand growth is set to outpace supply, leading to a reduction in the surplus, high inventory levels are anticipated to keep prices from rising significantly.
The modest supply growth is due to a 1.5 Bcf/d increase in production, slightly offset by a reduction in imports. Consumption in residential and commercial sectors is expected to rise due to forecasted colder weather, contrasting the warmer temperatures at the start and end of 2023.
The electric power sector may also see a slight consumption increase, while the industrial sector is expected to decrease. Exports, including pipeline and LNG, are forecasted to rise in 2024.
Summary of This Natural gas Technical Analysis Report:
- The Natural Gas market surged over 36% since the December low and then retraced now facing resistance near SMA(20) and 2.945-3.011. Now the market oscillates between 2.210 and 3.011, with support at 2.510.
- Post triangle breakout, the market retraced to near the 50% Fibonacci level, forming a bearish candle pattern. This points to a potential move down to 2.540, aligning with trendline support at 2.510.
- In the 4-hour chart, Natgas shows waning downside momentum, indicated by a bullish rejection candle at the rising 50-period average. Natural gas technical analysis suggests that a decisive break above 2.711 could lead to 2.810, with a fallback scenario to key supports if it breaks below 2.618.
Read the full Natural gas technical analysis report below.
Natural Gas Technical Analysis
Weekly Natural Gas Technical Analysis
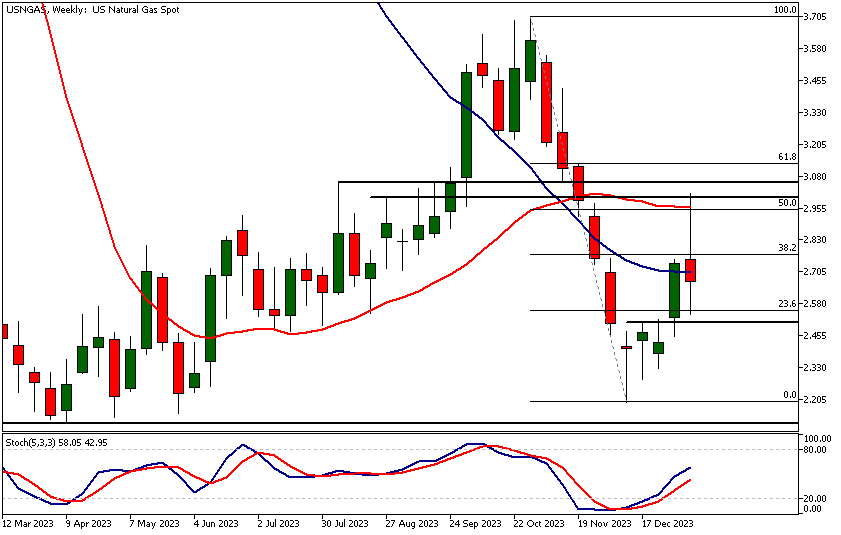
The Natural Gas market surged over 36% since the December low before retracing lower this week. The rally faltered at a market structure level, closely aligned with the SMA(20). Additionally, the 50% Fibonacci retracement level is in the same vicinity. The area from 2.945 to 3.011 forms the nearest key resistance, while the nearest support level is at 2.510.
The market has experienced wild fluctuations this week, but technically, it is now bullish following the reversal in December. Indicator-based Natural Gas technical analysis supports this view, as the Stochastic oscillator is pointing higher after giving a buy signal in December.
However, in the short term, the Natgas market could range between the support at 2.210 and the resistance area at 2.945 - 3.011.
Daily Natural Gas Technical Analysis
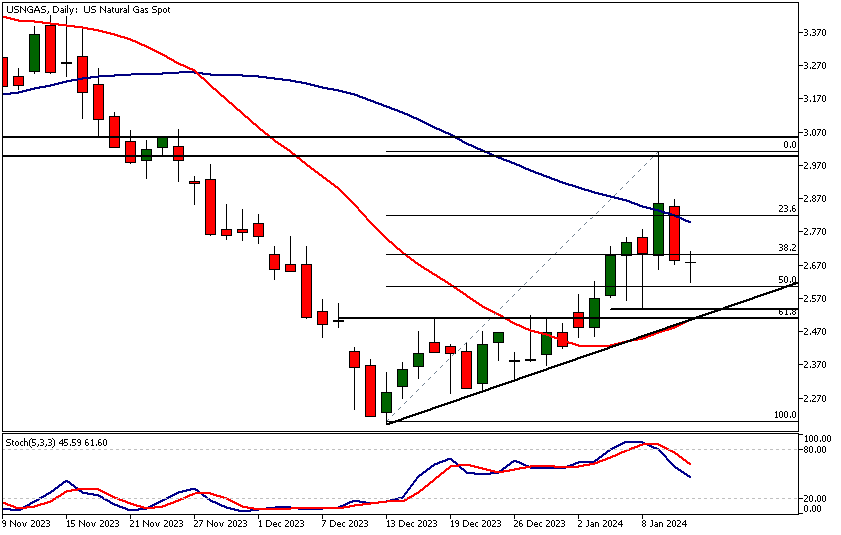
After breaking out of a triangle formation at the beginning of the year and rallying substantially, the market has now retraced to levels close to the 50% Fibonacci retracement. However, a bearish candle formation with a rejection candle followed by a momentum day to the downside suggests a potential downturn to 2.540.
This support level aligns closely with the rising trendline support and another support level at 2.510. Alternatively, if the market trades higher from current levels, it could test the dynamic resistance created by the 50-period moving average at 2.800.
Indicator-oriented Natural Gas technical analysis supports the view of a potential downturn, as the 50-period moving average and the Stochastic oscillator, which gave a sell signal two days ago, are both pointing lower.
Intraday Natural Gas Technical Analysis
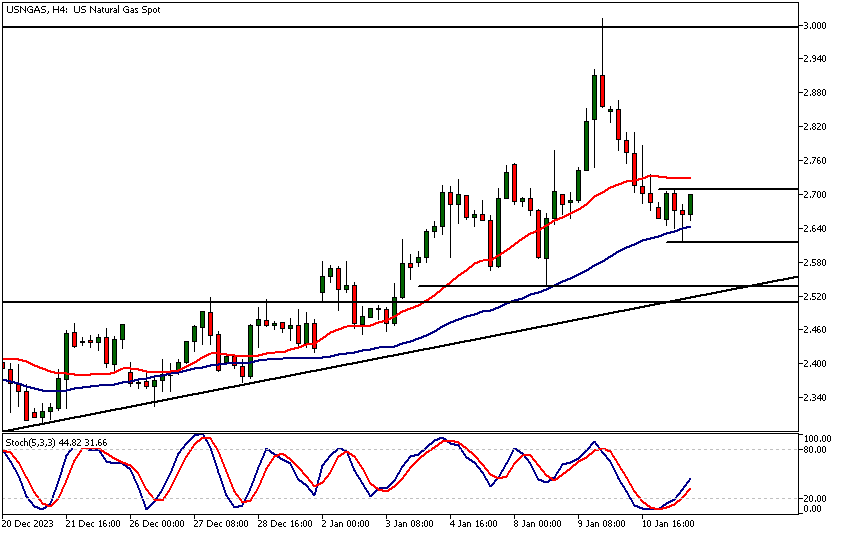
In the 4-Hour chart, Natgas shows signs of diminishing downside momentum as the market has created a bullish rejection candle at the 50-period moving average.
This potential reversal sign requires further confirmation. A decisive break above 2.711 could pave the way to 2.810. The Stochastic oscillator has given a buy signal and points higher, suggesting that momentum could be reversing to the upside.
Alternatively, a decisive break below 2.618 could lead the market to trade down to support levels defined in the weekly and daily Natural Gas technical analysis sections above.

Client sentiment analysis
84% of clients trading Natural Gas are holding long positions, while 16% are holding short positions. Client sentiment data is being provided by TIO Markets Ltd.
Please remember that the retail trader client sentiment is a contrarian indicator as most of the retail traders are on average betting against the market trends. This is why, experienced traders tend to trade against the retail client sentiment. You can follow the TIOmarkets client sentiment live on our Forex dashboard.
The next key risk events impacting this market:
- USD - Core PPI m/m
- USD - PPI m/m
- USD - Empire State Manufacturing Index
- USD - Core Retail Sales m/m
- USD - Retail Sales m/m
- USD - Industrial Production m/m
- USD - Unemployment Claims
- USD - Natural Gas Storage
- USD - Building Permits
- USD - Philly Fed Manufacturing Index
- USD - Prelim UoM Consumer Sentiment
- USD - Existing Home Sales
- USD - Prelim UoM Inflation Expectations
Potential Natural Gas Market Moves
The market could extend its gains potentially testing higher levels like 2.810, as suggested by the bullish rejection candle and Stochastic oscillator signals on the intraday chart. Alternatively, a decisive break below 2.618 could lead the market to trade down to 2.210.

How Would You Trade the Natural Gas Today?
I hope this fundamental and technical Natural Gas analysis helps you to make better informed trading decisions. Check the latest market analysis for other instruments and subscribe to receive them in your inbox as soon as they are published
DISCLAIMER: TIO Markets offers an exclusively execution-only service. The views expressed are for information purposes only. None of the content provided constitutes any form of investment advice. The comments are made available purely for educational and marketing purposes and do NOT constitute advice or investment recommendation (and should not be considered as such) and do not in any way constitute an invitation to acquire any financial instrument or product. TIOmarkets and its affiliates and consultants are not liable for any damages that may be caused by individual comments or statements by TIOmarkets analysis and assumes no liability with respect to the completeness and correctness of the content presented. The investor is solely responsible for the risk of his/her investment decisions. The analyses and comments presented do not include any consideration of your personal investment objectives, financial circumstances, or needs. The content has not been prepared in accordance with any legal requirements for financial analysis and must, therefore, be viewed by the reader as marketing information. TIOmarkets prohibits duplication or publication without explicit approval.

Janne Muta holds an M.Sc in finance and has over 20 years experience in analysing and trading the financial markets.
Related Posts


Trade responsibly: CFDs are complex instruments and come with a high risk of losing all your invested capital due to leverage.