Natural Gas Technical Analysis | Head and shoulders formation
BY Janne Muta
|November 17, 2023Natural gas technical analysis - The recent decline in natural gas prices is attributed to several factors: ample storage and production levels, mild weather reducing heating demand together with lower spot prices at the Henry Hub. Additionally, record output and changing market dynamics have pressured the prices.
Despite record demand, the market is influenced by high production output, above-average storage, and infrastructure flexibility. Production outpacing demand, along with above-average gas levels in storage, have also contributed to the price weakness.
Summary of This Natural gas Technical Analysis Report:
- After declining by nearly 16% in three weeks, the price of natural gas is fluctuating around a market structure level at 3.223. If the market starts to trade below this neckline level, it has created a medium-term market top.
- The daily chart shows how the supporting neckline has been penetrated twice. The market has also created a lower swing high at 3.422. As a result, the market has created a head and shoulders formation with a neckline at 3.422.
Read the full Natural gas technical analysis report below.
Natural Gas Technical Analysis
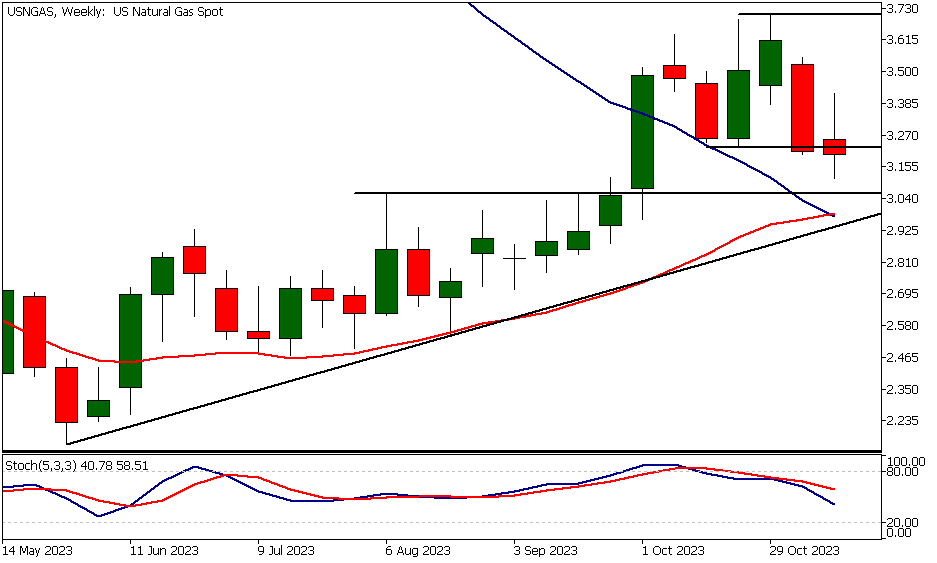
Weekly Natural Gas Technical Analysis
After declining by nearly 16% in three weeks, the price of natural gas is fluctuating around a market structure level at 3.223. If the market starts to trade below this neckline level, it has created a medium-term market top.
The nearest significant support level below the current market price is at 2.616, while the nearest major resistance level can be found at 3.704.
Confluence area
Below the 3.223 mark, we have a technical confluence area between 2.942 and 2.985, which could be targeted by the bears should the market trade lower from the current levels.
It's important to note that if natgas trades down to this zone, it would have broken decisively below the market top, switching the role of the 3.223 neckline level from support to resistance.
Trading considerations
Our natural gas technical analysis suggests that this could potentially dampen speculative buying that might otherwise occur within this range. After all, traders are always seeking to have a sufficiently high profit margin for their trades. If the nearest resistance level is too close to trade entry levels, long trades might not be worth the associated risk.
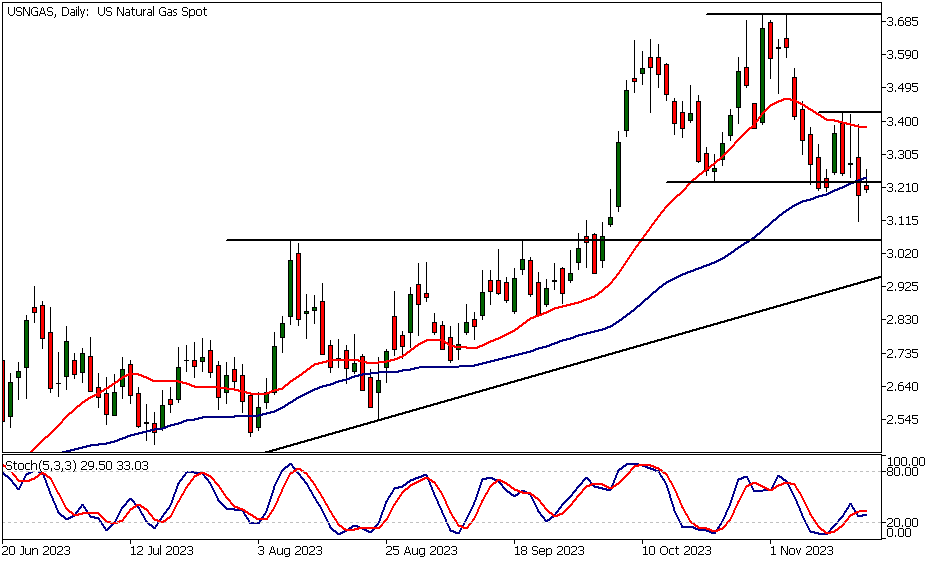
Daily Natural Gas Technical Analysis
The daily chart shows how the supporting neckline has been penetrated twice. The market has also created a lower swing high at 3.422. As a result, the market has created a head and shoulders formation with a neckline at 3.422.
Below this level, we should look for a move down to 2.967. Our natural gas technical analysis indicates that alternatively, the market could potentially close the gap at 3.583 if it was able to rally strongly above 3.422.
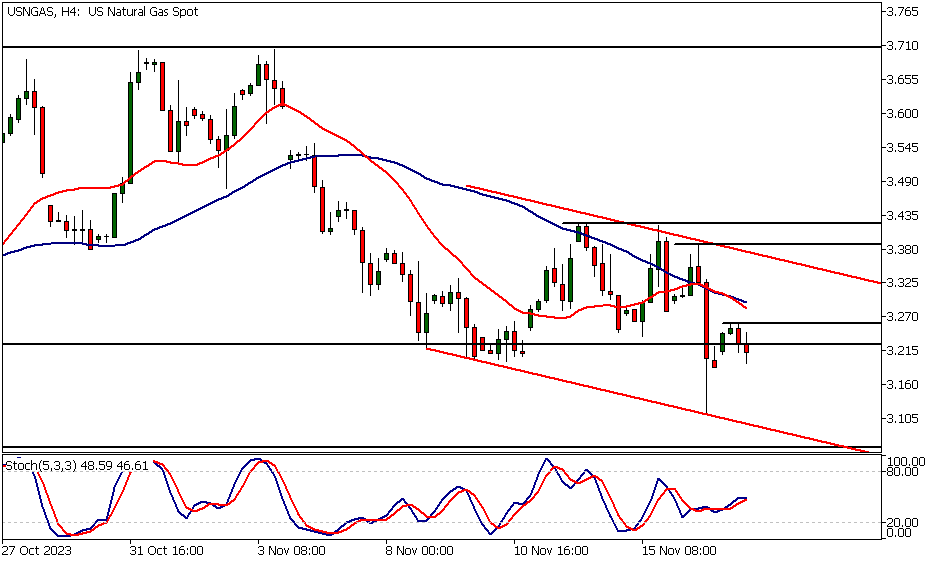
Natural Gas Technical Analysis, 4h
The intraday chart shows how the market created a double top at 3.419 before it started to decline. Natgas now trades in a bearish trend channel and has just created a lower swing high at 3.260. Below this level, the market could be targeting the channel low, currently at 3.095. Natural gas technical analysis indicates that above 3.260, the market could trade to 3.319.
Indicator-based natural gas technical analysis shows the moving averages pointing lower and in a bearish order, with the 20-period SMA below the SMA(50).
The next key risk events impacting this market:
- Prelim UoM Consumer Sentiment
- Prelim UoM Inflation Expectations
- US CPI
- Empire State Manufacturing Index
- US PPI
- US Retail Sales
Potential Natural Gas Market Moves
The market has created a head and shoulders formation with a neckline at 3.422. Below this level, we should look for a move down to 2.967.
Our natural gas technical analysis indicates that alternatively, the market could potentially close the gap at 3.583 if it was able to rally strongly above 3.422.

How would you trade the Natural Gas today?
I hope this fundamental and technical Natural Gas analysis helps you to make better informed trading decisions. Check the latest market analysis for other instruments and subscribe to receive them in your inbox as soon as they are published
DISCLAIMER: TIO Markets offers an exclusively execution-only service. The views expressed are for information purposes only. None of the content provided constitutes any form of investment advice. The comments are made available purely for educational and marketing purposes and do NOT constitute advice or investment recommendation (and should not be considered as such) and do not in any way constitute an invitation to acquire any financial instrument or product. TIOmarkets and its affiliates and consultants are not liable for any damages that may be caused by individual comments or statements by TIOmarkets analysis and assumes no liability with respect to the completeness and correctness of the content presented. The investor is solely responsible for the risk of his/her investment decisions. The analyses and comments presented do not include any consideration of your personal investment objectives, financial circumstances, or needs. The content has not been prepared in accordance with any legal requirements for financial analysis and must, therefore, be viewed by the reader as marketing information. TIOmarkets prohibits duplication or publication without explicit approval.

Janne Muta holds an M.Sc in finance and has over 20 years experience in analysing and trading the financial markets.
Related Posts


Trade responsibly: CFDs are complex instruments and come with a high risk of losing all your invested capital due to leverage.