Natural Gas Technical Analysis | Increased supply pressures Natgas prices
BY Janne Muta
|November 30, 2023Natural gas technical analysis - Natural gas prices have been declining over the past two weeks due to a number of factors, including milder weather, increased renewable energy production, and concerns about a potential recession.
US natural gas production has seen a notable rise, with output in the Lower 48 states reaching 107.0 billion cubic feet per day in November, surpassing the previous month's record. This surge in supply plays a crucial role in driving prices down.
Concurrently, the weather across major parts of the United States has been warmer than normal, reducing the demand for heating and thus impacting natural gas prices. Additionally, the season's first inventory decrease was smaller than anticipated, further indicating lower demand.
Summary of This Natural gas Technical Analysis Report:
- The price of natural gas has seen a significant decrease, plummeting over 14% in just three weeks following a bearish breakout from a market-topping formation. The width of this formation suggests a measured move target, which aligns closely with the support level at 2.709.
- In the daily chart, the natural gas market is on a downward trend, having broken below the market-topping formation previously discussed in our technical analyses. The nearest resistance area is identified between 2.931 and 2.973. The market maintains a bearish stance below this zone and might trade down to 2.709. If, however, the market rallies decisively above 2.973, it could test the next key resistance level at 3.079.
Read the full Natural gas technical analysis report below.
Natural Gas Technical Analysis
Weekly Natural Gas Technical Analysis
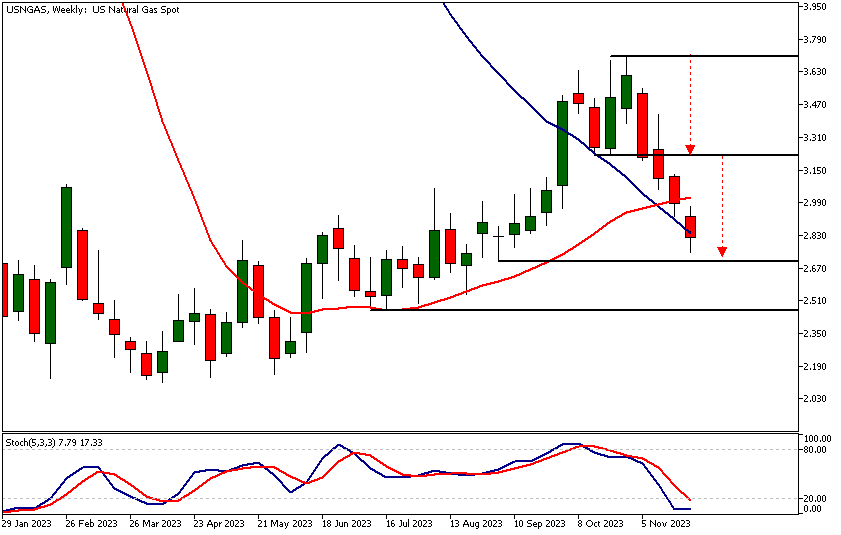
The price of natural gas has seen a significant decrease, plummeting over 14% in just three weeks following a bearish breakout from a market-topping formation. The width of this formation suggests a measured move target, which aligns closely with the support level at 2.709.
Typically, reaching a measured move target after a breakout could lead to profit-taking, potentially halting the downward trend. However, there's no certainty that the market will reverse direction after hitting this target. The natural gas market may also continue its bearish trend, trading even lower.
Importance of price action analysis
Consequently, traders should concentrate on price-action-oriented technical analysis in shorter time frame charts to discern possible market directions. If the market decisively breaches the 2.709 support level, we might see it dropping to around 2.55. Conversely, if it stays above 2.709, a move towards 2.80 could be expected.
Daily Natural Gas Technical Analysis
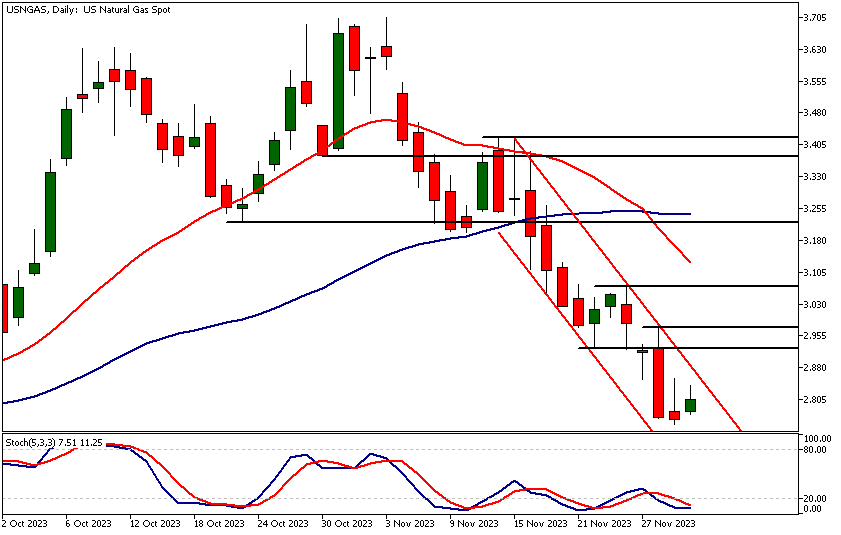
In the daily chart, the natural gas market is on a downward trend, having broken below the market-topping formation previously discussed in our technical analyses.
The nearest resistance area is identified between 2.931 and 2.973. The market maintains a bearish stance below this zone and might trade down to 2.709. If, however, the market rallies decisively above 2.973, it could test the next key resistance level at 3.079.
Bearish indicators
The bearish outlook is further supported by indicator-based technical analysis. The 20-period SMA has crossed below the 50-period SMA and is trending downwards. The stochastic oscillator is in the oversold region, but this doesn't reliably predict when the market might turn higher.
Natural Gas Technical Analysis, 4h
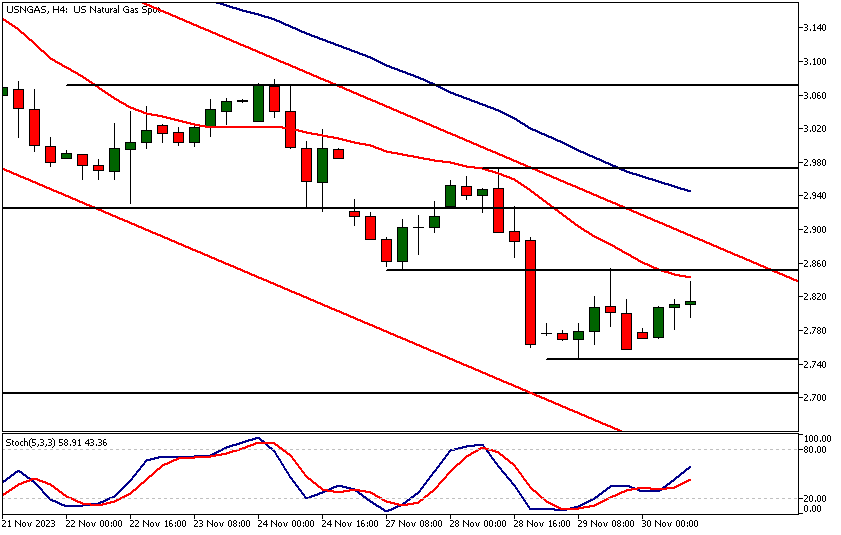
The 4h chart highlights a technical confluence near the 2.854 resistance level, where the 20-period SMA converges with this resistance.
The market has been experiencing sideways movement, and if the current candle closes below 2.811, it would create another bearish rejection candle, suggesting that the downward trend may be set to continue.
Both moving averages, the 20 and 50-period, are pointing lower, with the faster moving average positioned below the slower one. This reinforces the bearish bias in the market at this timeframe, as per our indicator-based natural gas technical analysis.
Client sentiment analysis
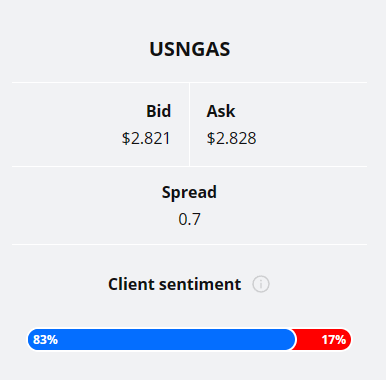
TIOmarkets' clients are bullish on USNGAS with 83% of them currently holding long positions in the market, while 17% of them are short the market.
Please remember that the retail trader client sentiment is a contrarian indicator as most of the retail traders are on average betting against the market trends. This is why, experienced traders tend to trade against the retail client sentiment. You can follow the TIOmarkets client sentiment live on our Forex dashboard.
The next key risk events impacting this market
- USD - ISM Manufacturing PMI
- USD - ISM Manufacturing Prices
- USD - Fed Chair Powell Speaks
Potential Natural Gas Market Moves
If the market decisively breaches the 2.709 support level, we might see it dropping to around 2.55. Conversely, if it stays above 2.709, a move towards 2.80 could be expected.

How would you trade the Natural Gas today?
I hope this fundamental and technical Natural Gas analysis helps you to make better informed trading decisions. Check the latest market analysis for other instruments and subscribe to receive them in your inbox as soon as they are published
DISCLAIMER: TIO Markets offers an exclusively execution-only service. The views expressed are for information purposes only. None of the content provided constitutes any form of investment advice. The comments are made available purely for educational and marketing purposes and do NOT constitute advice or investment recommendation (and should not be considered as such) and do not in any way constitute an invitation to acquire any financial instrument or product. TIOmarkets and its affiliates and consultants are not liable for any damages that may be caused by individual comments or statements by TIOmarkets analysis and assumes no liability with respect to the completeness and correctness of the content presented. The investor is solely responsible for the risk of his/her investment decisions. The analyses and comments presented do not include any consideration of your personal investment objectives, financial circumstances, or needs. The content has not been prepared in accordance with any legal requirements for financial analysis and must, therefore, be viewed by the reader as marketing information. TIOmarkets prohibits duplication or publication without explicit approval.

Janne Muta holds an M.Sc in finance and has over 20 years experience in analysing and trading the financial markets.
Related Posts


Trade responsibly: CFDs are complex instruments and come with a high risk of losing all your invested capital due to leverage.