Natural Gas Technical Analysis | The market falls almost 40%
BY Janne Muta
|December 11, 2023Natural gas technical analysis - The winter brought unexpected warmth, resulting in reduced demand for natural gas in the United States. This reduced demand has contributed to lower natural gas prices. Additionally, global LNG (liquefied natural gas) exports have been increasing, alleviating supply constraints and further pressuring prices downward. This trend is expected to persist in the coming months.
Furthermore, slower economic growth forecasts for the second half of 2023 are anticipated to diminish natural gas demand as both businesses and consumers cut back on spending, including energy consumption. Meanwhile, new natural gas production, notably in the United States and other countries, has added to the supply surplus.
In summary, unseasonably mild weather, expanding LNG exports, economic slowdown concerns, and increased natural gas production are the key factors driving down natural gas prices, creating a more abundant and affordable supply in the market.
Summary of This Natural gas Technical Analysis Report:
- The price of natural gas has declined by nearly 40% since its peak in October and roughly 30% since it broke below the topping formation we previously discussed in the Natural Gas technical analysis reports.
- The market is now approaching the lows seen in 2023, even though Natural Gas exchange-traded funds (ETFs) have been attracting increased inflows since the beginning of December.
Read the full Natural gas technical analysis report below.
Natural Gas Technical Analysis

Weekly Natural Gas Technical Analysis
The price of natural gas has declined by nearly 40% since its peak in October and roughly 30% since it broke below the topping formation we have previously discussed in the Natural Gas technical analysis reports.
The market is now approaching the lows seen in 2023, even though Natural Gas exchange-traded funds (ETFs) have been attracting increased inflows since the beginning of December.
If this year's low at 2.571 doesn't hold and the market continues to move lower, we could witness a drop to 1.880. Alternatively, if the market, trading at its lows for the year, meets sufficient demand to reverse the trend, we might see a move towards the 50-period SMA (at 2.746).

Daily Natural Gas Technical Analysis
The daily chart presents a similar technical picture, with the market experiencing a significant downward trend without much sideways movement. Consequently, it hasn't established any daily timeframe resistance levels since our previous natural gas technical analysis report.
The closest sideways movement occurred above 2.746. This level was tested once after the price broke below it, making it the nearest major daily timeframe resistance level on the chart.

Natural Gas Technical Analysis, 4h
The 4-hour chart also illustrates a sharp decline in price, lacking any significant rallies, with only sideways ranges that have ultimately resolved to the downside. The nearest range was formed above the 2.453 price level, making it the closest 4-hour resistance level.
Moving average-based natural gas technical analysis aligns with price action-based analysis, as the moving averages are pointing lower, and the 20-period moving average is below the 50-period SMA.
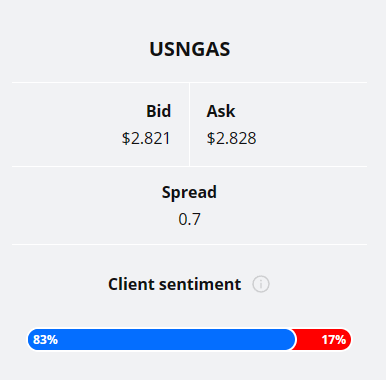
Client sentiment analysis
TIOmarkets' clients are extremely bullish on USNGAS with 94% of them currently holding long positions in the market, while 6% of them are short the market.
Please remember that the retail trader client sentiment is a contrarian indicator as most of the retail traders are on average betting against the market trends. This is why, experienced traders tend to trade against the retail client sentiment. You can follow the TIOmarkets client sentiment live on our Forex dashboard.
The next key risk events impacting this market
- USD - Core CPI
- USD - CPI
- USD - PPI and Core PPI
- USD - Federal Funds Rate
- USD - FOMC Economic Projections
- USD - FOMC Statement
- USD - FOMC Press Conference
Potential Natural Gas Market Moves
If this year's low at 2.571 doesn't hold and the market continues to move lower, we could witness a drop to 1.880. Alternatively, if the market, trading at its lows for the year, is sufficient to reverse the trend, we might see a move towards the 50-period SMA (at 2.746).

How Would You Trade Natural Gas Today?
I hope this fundamental and technical Natural Gas analysis helps you to make better informed trading decisions. Check the latest market analysis for other instruments and subscribe to receive them in your inbox as soon as they are published
DISCLAIMER: TIO Markets offers an exclusively execution-only service. The views expressed are for information purposes only. None of the content provided constitutes any form of investment advice. The comments are made available purely for educational and marketing purposes and do NOT constitute advice or investment recommendation (and should not be considered as such) and do not in any way constitute an invitation to acquire any financial instrument or product. TIOmarkets and its affiliates and consultants are not liable for any damages that may be caused by individual comments or statements by TIOmarkets analysis and assumes no liability with respect to the completeness and correctness of the content presented. The investor is solely responsible for the risk of his/her investment decisions. The analyses and comments presented do not include any consideration of your personal investment objectives, financial circumstances, or needs. The content has not been prepared in accordance with any legal requirements for financial analysis and must, therefore, be viewed by the reader as marketing information. TIOmarkets prohibits duplication or publication without explicit approval.

Janne Muta holds an M.Sc in finance and has over 20 years experience in analysing and trading the financial markets.
Related Posts


Trade responsibly: CFDs are complex instruments and come with a high risk of losing all your invested capital due to leverage.