Natural Gas Technical Analysis | The market trades near trendline support
BY Janne Muta
|November 23, 2023Natural gas technical analysis - The primary driver for lower prices is the unseasonably mild weather in key regions like Europe and the U.S., leading to a reduced demand for heating and consequently, a lower consumption of natural gas.
Compounding this effect is the significant increase in natural gas storage levels in the U.S., reaching a peak not seen in the last five years. This abundance acts as a safeguard against potential supply interruptions, exerting additional downward pressure on prices.
Economic factors are also at play. With mounting concerns over a looming recession, there's a palpable slowdown in energy demand as both businesses and consumers scale back expenditure, including on natural gas.
Moreover, the global LNG market is witnessing a surge, particularly from major producers such as Qatar and Australia. This increase in LNG supply is offering more alternatives to traditional pipeline gas, easing supply constraints further.
Summary of This Natural gas Technical Analysis Report:
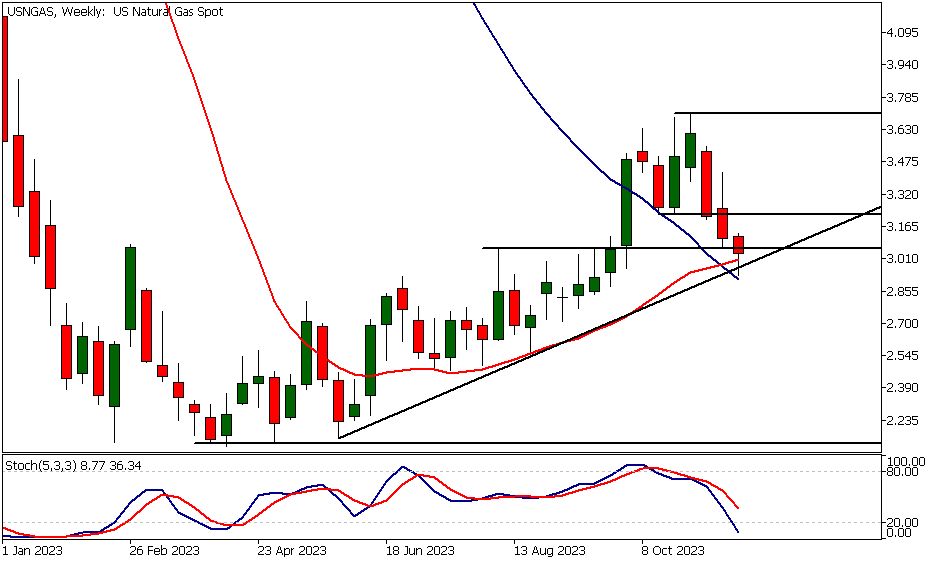
- The weekly chart shows that the natural gas price has been trading lower after it formed a topping formation and broke below it two weeks ago.
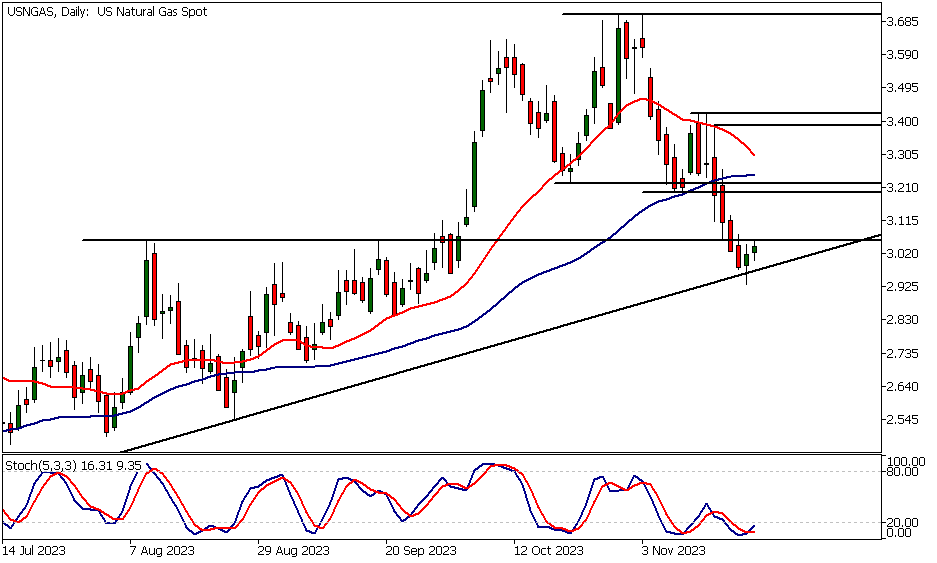
- The daily chart shows a reversal candle that was formed yesterday, and now the market is attempting to move above its high. If this rally attempt is successful, we could see the market trading up to 3.129.
- The primary driver for lower prices is the unseasonably mild weather in key regions like Europe and the U.S., leading to a reduced demand for heating and consequently, a lower consumption of natural gas.
Read the full Natural gas technical analysis report below.
Natural Gas Technical Analysis
Weekly Natural Gas Technical Analysis
The weekly chart shows that the natural gas price has been trading lower after it formed a topping formation and broke below it two weeks ago. The price moved down to an area where the 50-period moving average and the rising trendline support were closely aligned.
Now, the market has reacted slightly higher from this level as the stochastic oscillator is in the oversold territory. The nearest key resistance level on the weekly chart is at 3.243, while the next key weekly support level can be found at 2.709.
Daily Natural Gas Technical Analysis
The daily chart shows a reversal candle that was formed yesterday, and now the market is attempting to move above its high. Note how the high is closely aligned with a market structure level that used to be a resistance level.
If this rally attempt is successful, we could see the market trading up to 3.129. Alternatively, if the market breaks below yesterday's low of 2.931, a move to 2.850 could be likely.
Indicator-oriented natural gas technical analysis suggests that the market is currently oversold. This is in alignment with the market structure and price action-based technical analysis, as the market is now trading relatively close to an important rising trendline support.
Natural Gas Technical Analysis, 8h
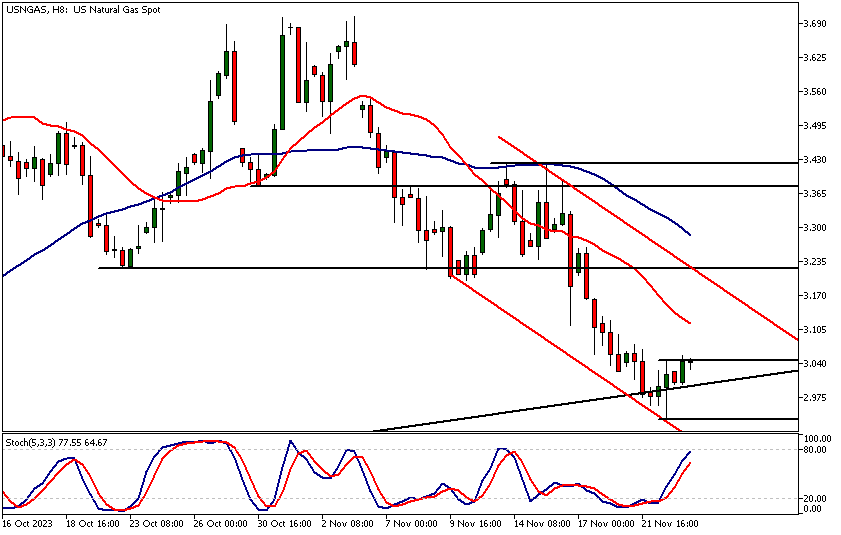
In the 8-hour chart, the market is in a bearish trend channel, with indicator-based natural gas technical analysis also suggesting a bearish market. The SMA(20) is below the SMA(50), and the averages are pointing downwards.
With the current reading of 76.76, the Stochastic oscillator is close to the overbought area of 80. The nearest major resistance level is at 3.223, but the market needs to first break decisively above yesterday's high (3.046) and create higher lows in the lower intraday timeframe charts to improve the chances of testing this level.
The next key risk events impacting this market:
- USD - Prelim GDP
- USD - Prelim GDP Price Index
- USD - Core PCE Price Index
- USD - ISM Manufacturing PMI
- USD - ISM Manufacturing Prices
- USD - Fed Chair Powell Speaks
Potential Natural Gas Market Moves
The daily chart shows a reversal candle that was formed yesterday, and now the market is attempting to move above its high. If this rally attempt is successful, we could see the market trading up to 3.129. Alternatively, if the market breaks below yesterday's low of 2.931, a move to 2.850 could be likely.

How would you trade the Natural Gas today?
I hope this fundamental and technical Natural Gas analysis helps you to make better informed trading decisions. Check the latest market analysis for other instruments and subscribe to receive them in your inbox as soon as they are published
DISCLAIMER: TIO Markets offers an exclusively execution-only service. The views expressed are for information purposes only. None of the content provided constitutes any form of investment advice. The comments are made available purely for educational and marketing purposes and do NOT constitute advice or investment recommendation (and should not be considered as such) and do not in any way constitute an invitation to acquire any financial instrument or product. TIOmarkets and its affiliates and consultants are not liable for any damages that may be caused by individual comments or statements by TIOmarkets analysis and assumes no liability with respect to the completeness and correctness of the content presented. The investor is solely responsible for the risk of his/her investment decisions. The analyses and comments presented do not include any consideration of your personal investment objectives, financial circumstances, or needs. The content has not been prepared in accordance with any legal requirements for financial analysis and must, therefore, be viewed by the reader as marketing information. TIOmarkets prohibits duplication or publication without explicit approval.

Janne Muta holds an M.Sc in finance and has over 20 years experience in analysing and trading the financial markets.
Related Posts


Trade responsibly: CFDs are complex instruments and come with a high risk of losing all your invested capital due to leverage.