Natural Gas Technical Analysis | Warm weather drives the price lower
BY Janne Muta
|November 10, 2023Natural gas technical analysis - Natgas prices have declined by over 13% in the last five trading days, primarily due to Europe's natural gas inventories reaching full capacity. The main contributor to these high storage levels is the warm weather.
Additionally, there is added pressure on the price of natural gas stemming from the USD strength and declining oil prices. The latter is triggered by concerns about a global economic slowdown and expectations that the Israel-Hamas war will not spread to the wider Middle East region.
Summary of This Natural gas Technical Analysis Report:
- The weekly chart indicates a potential top in the natural gas market, with possibilities of a downturn below 2.816 or an upward move to 3.380 depending on buyer engagement.
- The natural gas market's daily chart shows a significant double-top formation at 3.223, indicating a weakening uptrend. This suggests a potential decline to 2.816 or an increase to 3.380, depending on buyer activity.
- The 8-hour chart indicates a downward trend in the market, with resistance levels at 3.332 and 3.380, and a key support level at 2.816, aligned with a trend line and Fibonacci retracement.
Read the full Natural gas technical analysis report below.
Natural Gas Technical Analysis
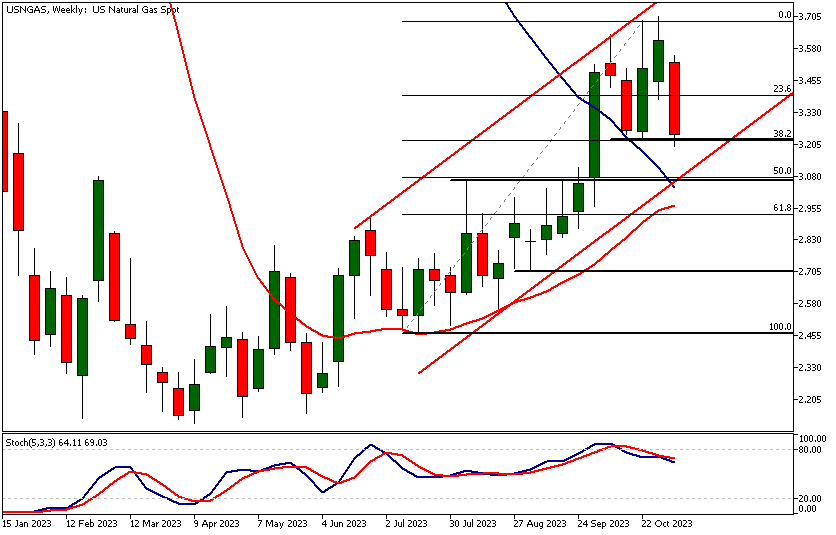
Weekly Natural Gas Technical Analysis
The weekly chart shows how the natural gas market is creating a market top. It is still trending higher, but after a long sideways move of 5 weeks and a strong move down, we could see the market trading lower and breaking the lower end of the bull channel at 2.816. Alternatively, if buyers engage with the market at 2.816 or levels above it, we could see a move to 3.380.
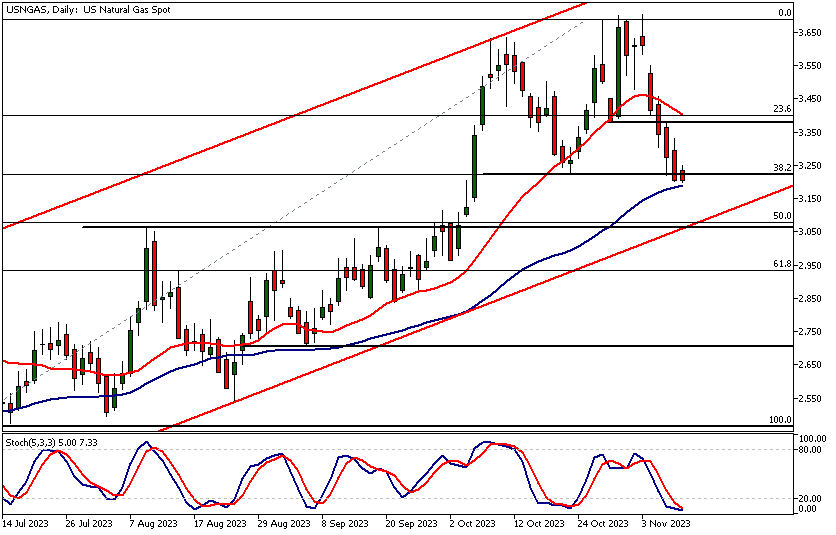
Daily Natural Gas Technical Analysis
The natural gas market is creating a sizable double-top formation in the daily chart. The market is trading at the neckline of this formation at 3.223, with the stochastic oscillator in the oversold area.
The double top is formed within the context of an uptrend, but after the sizable down move over the last five days (-13.4%) our natural gas technical analysis suggests that the trend is not very strong anymore.
Therefore, we could see the market trading down to the next market structure level at 2.816. However, if the market starts to attract buyers around 3.223, we could see it trading up to 3.380.
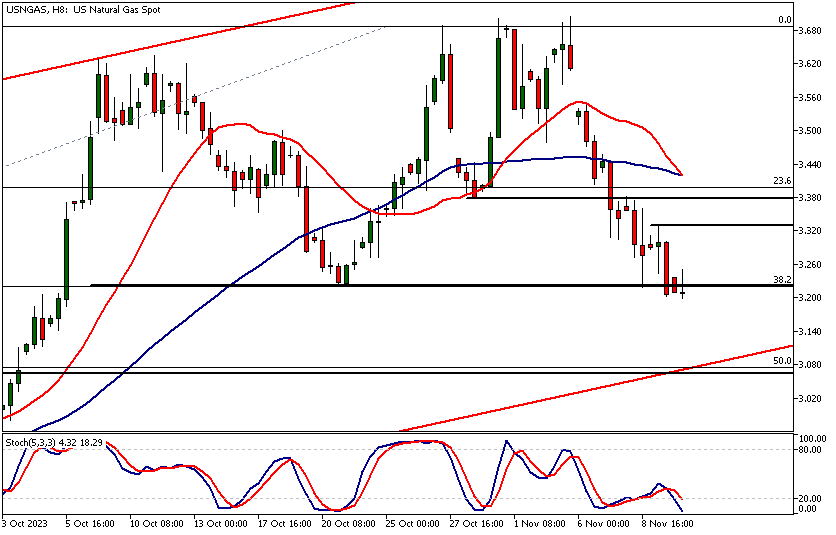
Natural Gas Technical Analysis, 8h
The 8-hour chart shows the market trending lower with two key resistance levels above the current market price at 3.332 and 3.380.
The nearest key support level at 2.816 roughly coincides with the rising trend line and the 50% Fibonacci retracement level. Therefore, natural gas technical analysis indicates we could see short covering if the market continues to trade down to this support level.
The next key risk events impacting this market:
- Prelim UoM Consumer Sentiment
- Prelim UoM Inflation Expectations
- US CPI
- Empire State Manufacturing Index
- US PPI
- US Retail Sales
Potential Natural Gas Market Moves
The weekly chart shows how the natural gas market is creating a market top. It is still trending higher, but after a long sideways move of 5 weeks and a strong move down, we could see the market trading lower and breaking the lower end of the bull channel at 2.816.
Alternatively, if buyers engage with the market at 2.816 or levels above it, we could see a move to 3.380.

How would you trade the Natural Gas today?
I hope this fundamental and technical Natural Gas analysis helps you to make better informed trading decisions. Check the latest market analysis for other instruments and subscribe to receive them in your inbox as soon as they are published
DISCLAIMER: TIO Markets offers an exclusively execution-only service. The views expressed are for information purposes only. None of the content provided constitutes any form of investment advice. The comments are made available purely for educational and marketing purposes and do NOT constitute advice or investment recommendation (and should not be considered as such) and do not in any way constitute an invitation to acquire any financial instrument or product. TIOmarkets and its affiliates and consultants are not liable for any damages that may be caused by individual comments or statements by TIOmarkets analysis and assumes no liability with respect to the completeness and correctness of the content presented. The investor is solely responsible for the risk of his/her investment decisions. The analyses and comments presented do not include any consideration of your personal investment objectives, financial circumstances, or needs. The content has not been prepared in accordance with any legal requirements for financial analysis and must, therefore, be viewed by the reader as marketing information. TIOmarkets prohibits duplication or publication without explicit approval.

Janne Muta holds an M.Sc in finance and has over 20 years experience in analysing and trading the financial markets.
Related Posts


Trade responsibly: CFDs are complex instruments and come with a high risk of losing all your invested capital due to leverage.