NZDCHF analysis | Double bottom forming in the weekly chart
BY Janne Muta
|November 2, 2023NZDCHF Analysis - The currency pair rallies ahead of the SNB Chairman Jordan's speech today and the RBNZ statement of intent (Sol) due to be released tomorrow.
The SoI is a four-year strategy document and outlines the RBNZ's objectives for monetary policy, financial stability, and cash operations. The more hawkish the tone of language in the document the better it is for the NZD bulls.
On Tuesday next week, Switzerland's State Secretariat for Economic Affairs report on the latest employment trends and the Swiss National Bank on the country's foreign currency reserves.
Summary of This NZDCHF Analysis Report:
- The NZDCHF formed a double bottom on the weekly chart, indicating bullishness. If the market surpasses 0.5511, it might reach 0.5660. Two confluence zones exist at 0.5511 and 0.5843. If 0.5511 isn't breached, 0.5190 may be retested.
- Daily chart shows market rallying strongly from 0.5190. However, NZDCHF is approaching 50% Fibonacci level, with the stochastic oscillator in the overbought area. Potential to reach 0.5407 or retrace to 0.5265.
- The 8-hour chart shows a bullish trend with the nearest confluence area above 50-period average at 0.5278. If no buyers emerge at this level, NZDCHF might trade down to levels between 23.6% Fibonacci and 20-period SMA near 0.5263. Resistance at 0.5356 aligns with 50% Fibonacci.
Read the full NZDCHF analysis report below.
NZDCHF Analysis
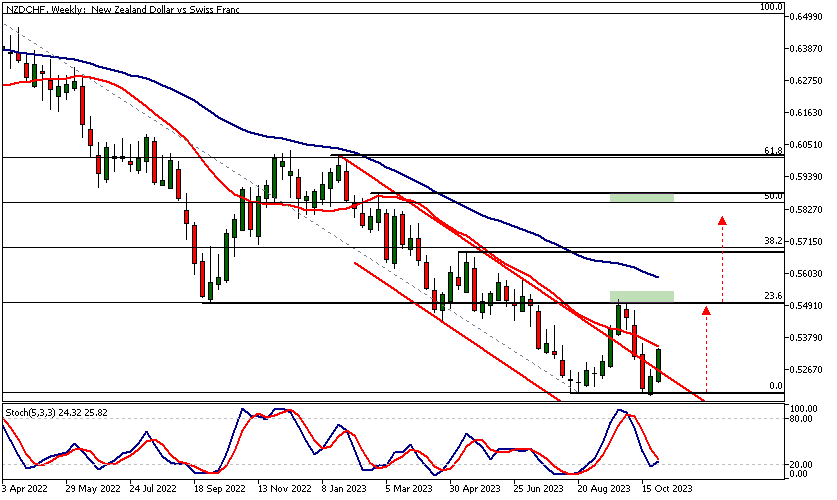
Weekly NZDCHF Analysis
The NZDCHF currency pair has just formed a double bottom on the weekly timeframe chart. Although the moving averages are still pointing downward and the 20-period moving average is below the 50-period SMA, the double bottom indicates that the balance of supply and demand has shifted in favour of the Bulls.
If the market can now rally above the 23.6% Fibonacci retracement level at 0.5511, our NZDCHF analysis suggests the market could trade up to 0.5660 or thereabouts. The 23.6% retracement level coincides with a key market structure level at 0.5511, which also serves as the neckline for the double bottom formation. Thus, the area around this level is a confluence zone.
Measured move projection
Note that the measured move projection based on the width of the double-bottom formation points to levels near the 50% Fibonacci retracement level (at 0.5843). This level aligns closely with a market structure level, making the area near the 50% retracement level another confluence zone.
This confluence zone could serve as a medium-term target on the weekly timeframe chart if the market's bullishness persists. Alternatively, if the 0.5511 level isn't breached, the 0.5190 low might be tested for the third time.
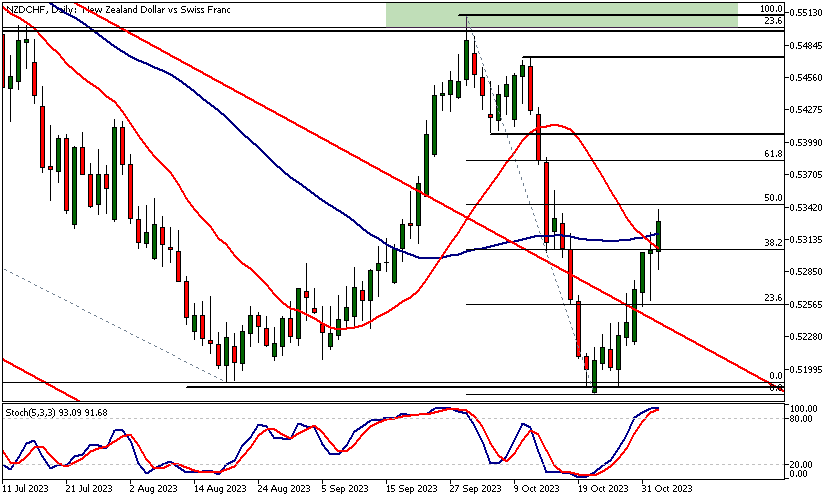
Daily NZDCHF Analysis
The daily timeframe chart shows the market rallying strongly from the 0.5190 support level. At the time of writing, the market is approaching the 50% Fibonacci retracement level, and the stochastic oscillator is deeply in the overbought territory.
The market might find it challenging to continue advancing without any pullbacks as it nears the 50% Fibonacci retracement level. If the Bulls can push the market further, the next key price level as per our NZDCHF analysis at 0.5407 could come into play. Alternatively, the market might retrace back to 0.5265.
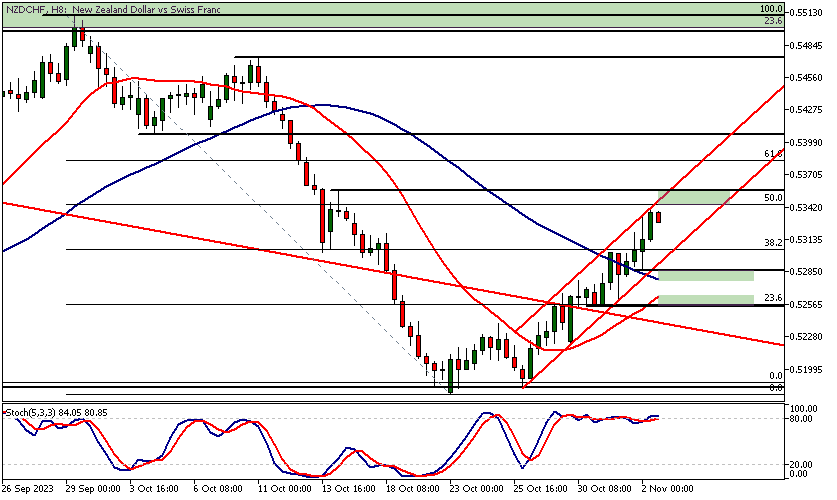
NZDCHF Analysis, 8h Chart
The 8-hour chart reveals the market trending higher in a bullish trend channel, with the nearest confluence area just above the 50-period moving average. This is where the bullish channel and the moving average coincide with a minor market structure level.
If this area fails to attract buyers, NZDCHF analysis indicates that we could see the market trading down to the next complex area between the 23.6% Fibonacci retracement level and the 20-period SMA. The nearest resistance level at 0.5356 is closely aligned with the 50% Fibonacci retracement level.
The key risk events impacting this market today:
- SNB Chairman Jordan Speaks
- RBNZ Statement of Intent
- Unemployment Rate
- Switzerland CPI

Potential NZDCHF Market Moves
On the weekly chart, a double bottom formation suggests a potential trend reversal. The daily shows strong support at 0.5190, with the 4-hour chart revealing a bullish trend channel, indicating potential upward momentum towards the 0.5407 resistance.
Despite weekly bullish signs, the daily stochastic oscillator is in the overbought territory. The 8-hour chart highlights potential resistance near the 50% Fibonacci retracement. If rejected, prices might retreat towards the 23.6% level and 0.5265 daily support and then perhaps to the October low at 0.5177.,
How would you trade the NZDCHF today?
I hope this fundamental and technical NZDCHF analysis helps you to make better informed trading decisions. Check the latest market analysis for other instruments and subscribe to receive them in your inbox as soon as they are published
DISCLAIMER: TIO Markets offers an exclusively execution-only service. The views expressed are for information purposes only. None of the content provided constitutes any form of investment advice. The comments are made available purely for educational and marketing purposes and do NOT constitute advice or investment recommendation (and should not be considered as such) and do not in any way constitute an invitation to acquire any financial instrument or product. TIOmarkets and its affiliates and consultants are not liable for any damages that may be caused by individual comments or statements by TIOmarkets analysis and assumes no liability with respect to the completeness and correctness of the content presented. The investor is solely responsible for the risk of his/her investment decisions. The analyses and comments presented do not include any consideration of your personal investment objectives, financial circumstances, or needs. The content has not been prepared in accordance with any legal requirements for financial analysis and must, therefore, be viewed by the reader as marketing information. TIOmarkets prohibits duplication or publication without explicit approval.
Join us on social media

Janne Muta holds an M.Sc in finance and has over 20 years experience in analysing and trading the financial markets.
Related Posts


Trade responsibly: CFDs are complex instruments and come with a high risk of losing all your invested capital due to leverage.