NZDUSD Technical Analysis | Diverging central bank policies support NZDUSD
BY Janne Muta
|November 27, 2023NZDUSD Technical Analysis - The anticipated divergence between the Federal Reserve's more accommodative interest rate policy and the Reserve Bank of New Zealand's expected hawkish approach indicates that the New Zealand Dollar (NZD) is positioned to strengthen against the US dollar.
In two days’ time the Reserve Bank of New Zealand (RBNZ) announces its interest rate decision. The central bank is expected to keep the OCR unchanged at 5.5% as the economy struggles with high inflation and increasing producer input prices.
High inflation and a rise in producer input prices point to sustained cost pressures, while a drop in the Consumer Price Index (CPI) to 5.6% (6% prior) and a slight easing October food inflation probably isn’t significant enough to alter the central bank's policy direction.
The recent retail sales data shows consistent declines, suggesting consumer spending reduction possibly due to increased living costs and inflation. Friday’s release indicates consumers are reducing spending on discretionary items such as vehicles as high inflation forces them to direct spending on daily essentials.
These patterns imply cautious consumer behaviour in response to inflationary pressures and support the case for the RBNZ to continue a restrictive monetary policy.
October trade deficit narrowed compared to the same month in the previous year. This reduction was primarily due to a significant decline in imports, which decreased more than exports. The fall in imports resulted from reduced purchases of machinery, equipment, and vehicles.
On the export side, there was a decrease in the outbound shipments of dairy products, fruits, meat, and logs. Decreasing imports while exports remain strong would have been preferable. Nonetheless, despite the export downturn, the New Zealand Dollar is expected to stay stable or potentially appreciate against the dollar in the short term.
Summary of This NZDUSD Technical Analysis Report:
- The NZDUSD currency pair has rallied over 5% since the October low. This bullish move has taken the market above a significant market structure level at 0.6048. This level has, since October 2022, acted as both support and resistance, marking it as a psychologically significant price level.
- In the daily chart, the NZDUSD is bullish, creating higher lows and higher highs, and consistently breaking resistance levels. The nearest key support level on the daily timeframe chart is at 0.5996. Above this level, the market could be targeting 0.6133, the nearest key resistance level. Alternatively, should the market fail to attract buyers above the higher swing low at 0.5996, a move down to 0.5950 could be likely.
Read the full NZDUSD technical analysis report below.
NZDUSD Technical Analysis
Weekly NZDUSD Technical Analysis
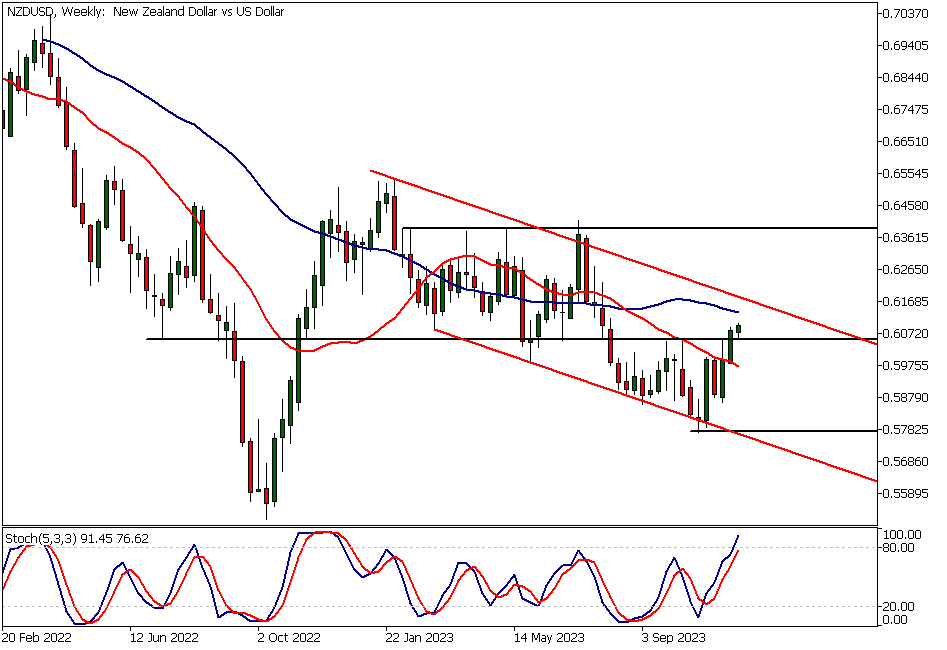
The NZDUSD currency pair has rallied over 5% since the October low. This bullish move has taken the market above a significant market structure level at 0.6048. This level has, since October 2022, acted as both support and resistance, marking it as a psychologically significant price level.
However, despite the recent strong rally, the market still remains in a bearish trend channel in the weekly chart while indicator-based NZDUSD technical analysis suggests the market remains bearish. The 20-period SMA is below the 50-period SMA and they point lower. At the same time, the stochastic oscillator has just moved into the overbought area, suggesting the recent rally could soon slow down.
It's important to remember that indicators follow price, and thus the price action itself is the most critical indicator. Therefore, even if the market is in a downtrend on the weekly chart, an overbought condition in the stochastic oscillator is not a reason to sell the market short. Traders should follow price action in weekly, daily and intraday timeframes and act accordingly.
NZDUSD EURUSD Technical Analysis
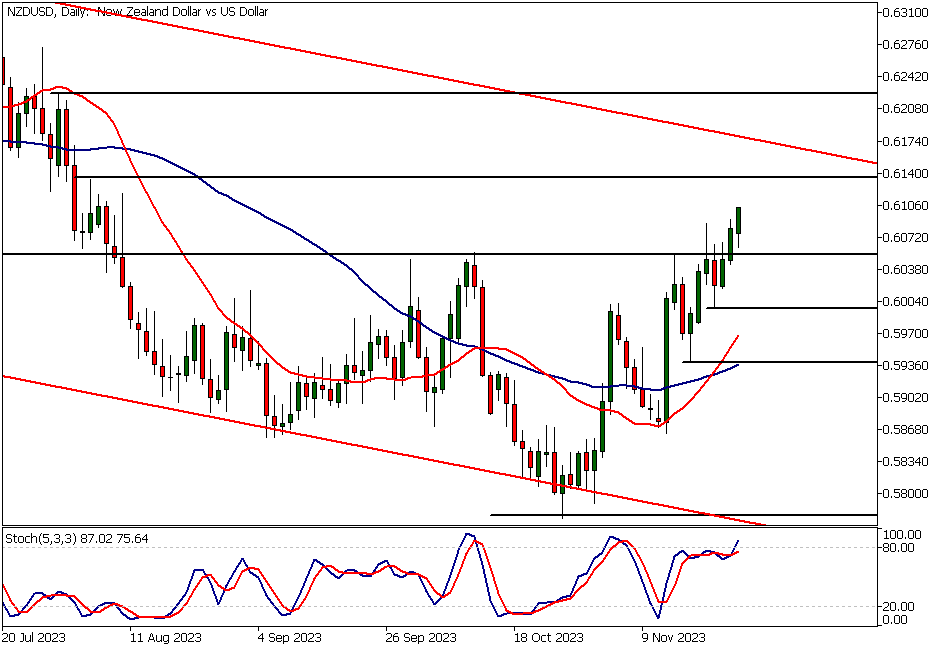
In the daily chart, the NZDUSD is bullish, creating higher lows and higher highs, and consistently breaking resistance levels. The nearest key support level on the daily timeframe chart is at 0.5996.
Above this level, the market could be targeting 0.6133, the nearest key resistance level. Alternatively, should the market fail to attract buyers above the higher swing low at 0.5996, a move down to 0.5950 could be likely.
As the 20-period moving average is pointing higher and has crossed above the 50-period SMA, indicator-based NZDUSD technical analysis aligns with our bullish price action analysis conclusions for the daily timeframe.
NZDUSD Technical Analysis, 2h Chart
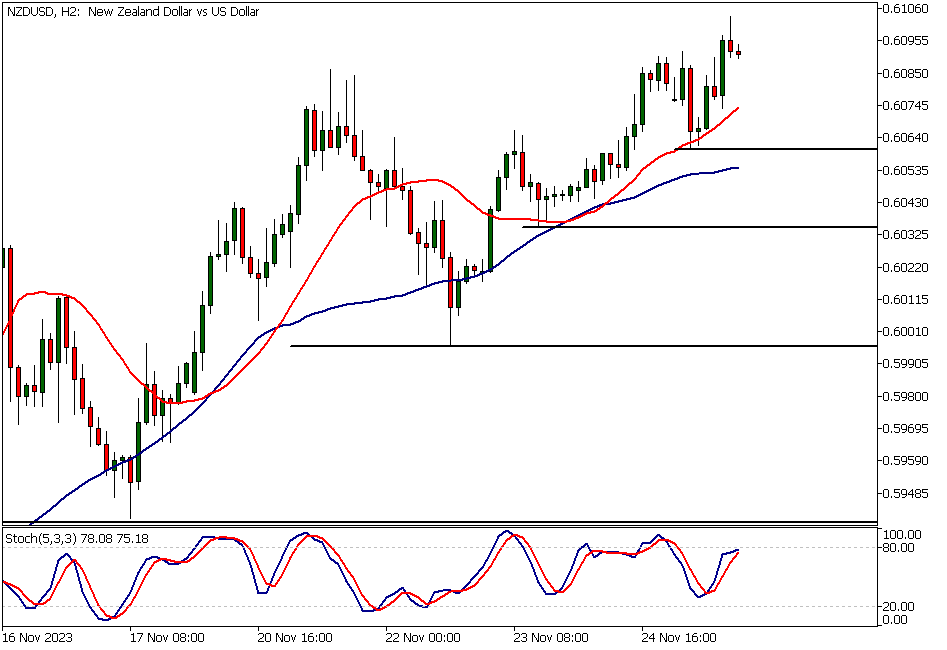
In the 2-hour chart, the market is also bullish, with moving averages pointing higher and the price well above the 20-period SMA. Note however, that the last complete 2h candle is a bearish rejection candle which suggest the market could soon retrace lower.
The nearest key support levels to focus on are at 0.6035 and 0.6061. In bullish market conditions, it makes sense to monitor price action at key support levels to see if there is evidence of renewed buying after retracements to these levels.
Client sentiment analysis
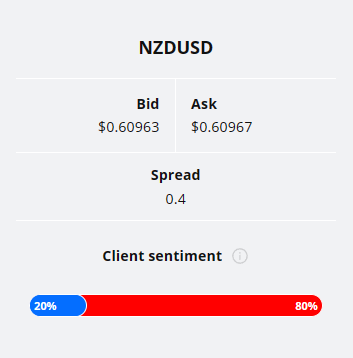
TIOmarkets' clientele are very bearish on NZDUSD, with 80% of clients holding short positions and only 20% favouring the long side.
Please remember that the retail trader client sentiment is a contrarian indicator as most of the retail traders are on average betting against the market trends. This is why, experienced traders tend to trade against the retail client sentiment. You can follow the TIOmarkets client sentiment live on our Forex dashboard.
The next key risk events impacting this market
Sure, here's the list cleaned up to include only the events and their respective currency symbols:
- USD - S&P/CS Composite-20 HPI
- USD - CB Consumer Confidence
- USD - Richmond Manufacturing Index
- USD - FOMC Member Waller Speaks
- NZD - Official Cash Rate
- NZD - RBNZ Monetary Policy Statement
- NZD - RBNZ Rate Statement
- NZD - RBNZ Press Conference
- USD - Prelim GDP
- USD - Prelim GDP Price Index
- USD - Core PCE Price Index
- USD - Unemployment Claims
- USD - Chicago PMI
- USD - Pending Home Sales
- USD - ISM Manufacturing PMI
- USD - ISM Manufacturing Prices
- USD - Fed Chair Powell Speaks
Potential NZDUSD Market Moves
The nearest key support level on the daily timeframe chart is at 0.5996. Above this level, the market could be targeting 0.6133, the nearest key resistance level. Alternatively, should the market fail to attract buyers above the higher swing low at 0.5996, a move down to 0.5950 could be likely.

How would you trade the NZDUSD today?
I hope this NZDUSD technical analysis report helps you to make better informed trading decisions. Check the latest market analysis for other instruments and subscribe to receive them in your inbox as soon as they are published
DISCLAIMER: TIO Markets offers an exclusively execution-only service. The views expressed are for information purposes only. None of the content provided constitutes any form of investment advice. The comments are made available purely for educational and marketing purposes and do NOT constitute advice or investment recommendation (and should not be considered as such) and do not in any way constitute an invitation to acquire any financial instrument or product. TIOmarkets and its affiliates and consultants are not liable for any damages that may be caused by individual comments or statements by TIOmarkets analysis and assumes no liability with respect to the completeness and correctness of the content presented. The investor is solely responsible for the risk of his/her investment decisions. The analyses and comments presented do not include any consideration of your personal investment objectives, financial circumstances, or needs. The content has not been prepared in accordance with any legal requirements for financial analysis and must, therefore, be viewed by the reader as marketing information. TIOmarkets prohibits duplication or publication without explicit approval.

Janne Muta holds an M.Sc in finance and has over 20 years experience in analysing and trading the financial markets.
Related Posts


Trade responsibly: CFDs are complex instruments and come with a high risk of losing all your invested capital due to leverage.