Oil Technical Analysis | Bullish or bearish trajectory?
BY Janne Muta
|December 15, 2023Oil Technical Analysis
Weekly Oil Technical Analysis
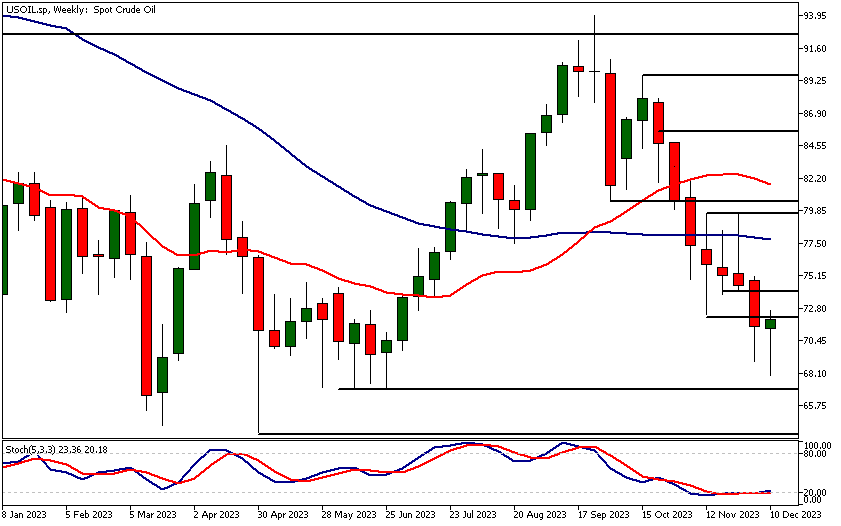
The crude oil market has gained momentum this week after a decline from its September high. If the market closes above $71.38, its opening level this week, it would form a weekly bullish rejection candle. This pattern suggests institutional buying and could potentially lead to market rallying higher. The nearest weekly support level is at $67.12.
Currently, the market is trading at a weekly low of $72.33, a level last seen four weeks ago. If this resistance level is breached, the market could likely move towards $73.80. However, as the market is in a long-term sideways range, the moving average-based oil technical analysis presents mixed signals on the weekly chart.

Daily Oil Technical Analysis
The daily chart shows that the market has tested the $72.33 low once and has now returned to this resistance level. If the market rallies above this level, the next key resistance at $74.14 could be tested. This level roughly aligns with the 20-period moving average which adds to the significance of this resistance level.
The moving averages are trending lower, with the 20-period moving average below the 50-period SMA, indicating bearishness according to the indicator-based oil technical analysis. The stochastic oscillator is nearing the overbought zone.

Intraday Oil Technical Analysis
On the intraday chart, the market has formed a small flag pattern today. If this pattern resolves upward, the measured move target of $76 becomes relevant. However, to reach this target, the market needs to break through the $74.14 resistance level and the top of the descending trend channel.
Conversely, if the flag resolves downward, the market could trade down to around $69.50. Currently, the market is trading above the moving averages, which are moving sideways, suggesting potential bullishness according to the moving average-based oil technical analysis.
However, these are still only preliminary indications, and traders are advised to continue monitoring the market's reaction to key price levels and its ability to break through resistance levels. Otherwise the market is likely to remain in a downtrend.
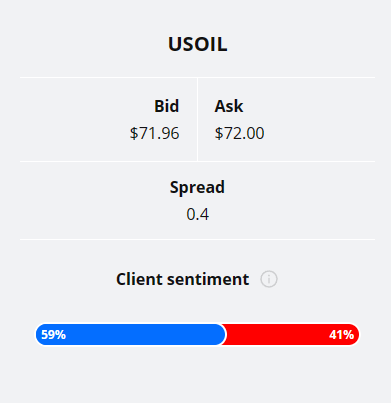
Client sentiment analysis
59% of clients trading USOIL are holding long positions, while 41% are holding short positions. Client sentiment data is being provided by TIO Markets Ltd.
It’s good to remember that retail client trading sentiment is a contrarian indicator as most retail traders are on average trading against market price trends. This is why experienced traders tend to trade against the retail client sentiment. You can follow the TIOmarkets client sentiment live on our Forex dashboard.
The next key risk events impacting this market
- USD - Flash Manufacturing PMI
- USD - Flash Services PMI
- USD - Building Permits
- USD - CB Consumer Confidence
- USD - Crude Oil Inventories
- USD - Final GDP q/q
- USD - Final GDP Price Index q/q
- USD - Philly Fed Manufacturing Index
Potential Oil Market Moves
In a bullish scenario, overcoming the $74.14 resistance could propel the market towards $76. Conversely, a bearish turn might see a decline to around $69.50 if the current flag pattern resolves downward, with key indicators like moving averages and the stochastic oscillator providing critical insights.

How Would You Trade Oil Today?
I hope this Oil technical analysis helps you to make better informed trading decisions. Check the latest market analysis for other instruments and subscribe to receive them in your inbox as soon as they are published
DISCLAIMER: TIO Markets offers an exclusively execution-only service. The views expressed are for information purposes only. None of the content provided constitutes any form of investment advice. The comments are made available purely for educational and marketing purposes and do NOT constitute advice or investment recommendation (and should not be considered as such) and do not in any way constitute an invitation to acquire any financial instrument or product. TIOmarkets and its affiliates and consultants are not liable for any damages that may be caused by individual comments or statements by TIOmarkets analysis and assumes no liability with respect to the completeness and correctness of the content presented. The investor is solely responsible for the risk of his/her investment decisions. The analyses and comments presented do not include any consideration of your personal investment objectives, financial circumstances, or needs. The content has not been prepared in accordance with any legal requirements for financial analysis and must, therefore, be viewed by the reader as marketing information. TIOmarkets prohibits duplication or publication without explicit approval.
Join us on social media

Janne Muta holds an M.Sc in finance and has over 20 years experience in analysing and trading the financial markets.
Related Posts


Trade responsibly: CFDs are complex instruments and come with a high risk of losing all your invested capital due to leverage.