Oil Technical Analysis | Hedge funds are buying oil
BY Janne Muta
|January 18, 2024Oil Technical Analysis - As the market stabilises, hedge funds have been cautiously purchasing oil ahead of reports that the International Energy Agency (IEA) and OPEC projecting a robust increase in global oil demand this year. The IEA raised its demand growth forecast by 180,000 barrels per day (bpd) to 1.24 million bpd for 2024, citing economic expansion and lower prices in the fourth quarter.
Meanwhile, OPEC's demand growth projection remains at 2.25 million bpd. Despite the volatility in supply and demand and ongoing tensions in the Middle East, the IEA anticipates a well-balanced oil market in 2024.
Hedge funds are cautiously investing in oil amidst escalating geopolitical tensions, including Houthi assaults in the Red Sea and Pakistan's military actions in Iran, which are exerting pressure on oil prices. In the United States, North Dakota reported a significant reduction in oil production owing to severe cold weather. Anticipation is building for the upcoming U.S. government report on oil inventories, especially after a noted rise in crude stockpiles.
Summary of This Oil Technical Analysis Report:
- Oil has created a higher reactionary low at 67.94 and has since then continued to consolidate, creating a bullish triangle formation. The top of the triangle formation is at 76.18. If the triangle is resolved to the upside, we could see the market trading higher to the 72.33 - 80.62 range. A bearish breakout from could move the market down to 66.93.
- Oil rallied over 3% from yesterday's low. The market attracted buyers at a rising trend line support and created a bullish rejection candle yesterday. Above 70.60, look for a move to 75.28. Alternatively, below yesterday's low, the market could move down to 69.40.
- The 8-hour chart shows the nearest resistance level at 73.65. If this can be penetrated decisively, the market could trade up to the 75.28 - 76.18 range. Alternatively, if the minor support level at 72.12 breaks, the market might trade down to yesterday's low at 70.60.
Read the full oil technical analysis report below.
Oil Technical Analysis
Weekly Oil Technical Analysis
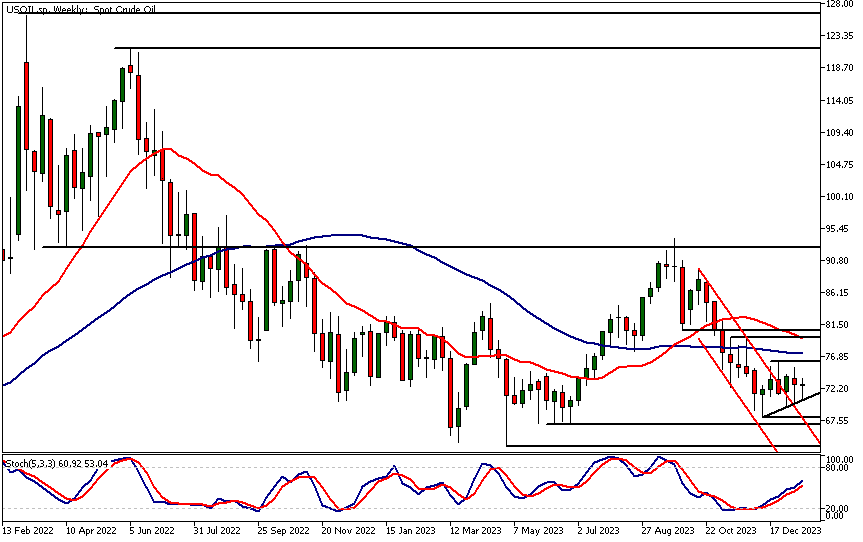
Oil has created a higher reactionary low at 67.94 and has since then continued to consolidate, creating a bullish triangle formation. The top of the triangle formation is at 76.18.
If the triangle is resolved to the upside, we could see the market trading higher to the 72.33 - 80.62 range. A bearish breakout from could move the market down to 66.93. The stochastic oscillator is moving higher, indicating bullishness in the market, while the moving averages are moving sideways due to the long-term sideways range in oil.
Daily Oil Technical Analysis
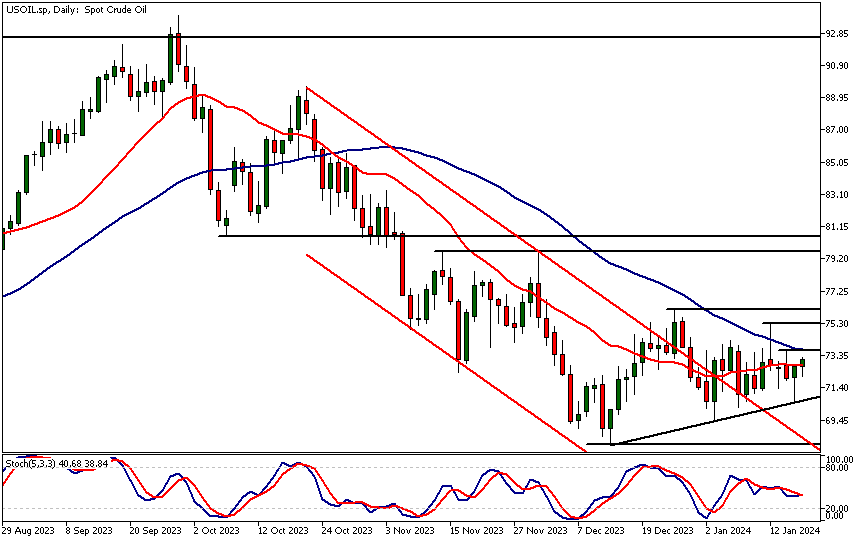
Oil rallied over 3% from yesterday's low. The market attracted buyers at a rising trend line support and created a bullish rejection candle yesterday. The moving averages continue contracting, with the SMA(20) approaching the slower SMA(50). Oil technical analysis, therefore, indicates higher prices for the coming days. Above 70.60, look for a move to 75.28. Alternatively, below yesterday's low, the market could move down to 69.40.
Intraday Oil Technical Analysis
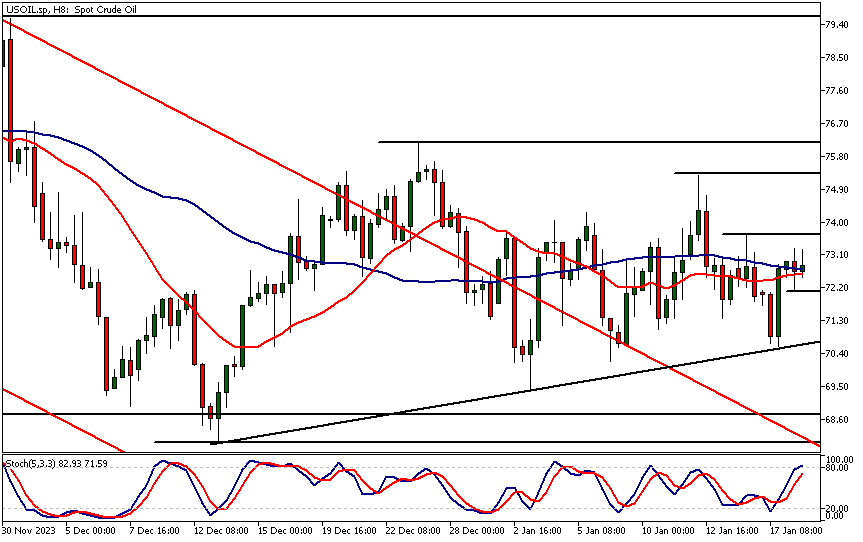
The 8-hour chart shows the nearest resistance level at 73.65. If this can be penetrated decisively, the market could trade up to the 75.28 - 76.18 range. Alternatively, if the minor support level at 72.12 breaks, the market might trade down to yesterday's low at 70.60. However, the bullish rejection candle we identified in the daily oil technical analysis section above indicates that the market bias could be to the upside.
Client sentiment analysis
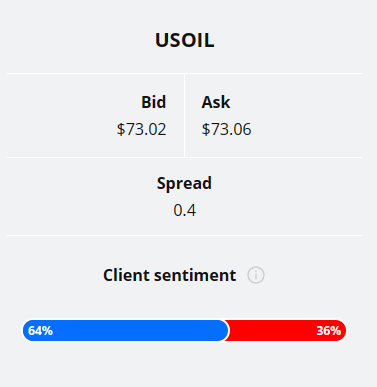
64% of clients trading USOIL are holding long positions, while 36% are holding short positions. Client sentiment data is being provided by TIO Markets Ltd.
Please note that retail client trading sentiment is generally a contrarian indicator, as private (non-professional) traders, on average, trade against market price trends. You can follow the TIOmarkets client sentiment live on our Forex dashboard.
The next key risk events impacting this market
- OIL - US oil inventories
- USD - Prelim UoM Consumer Sentiment
- USD - Existing Home Sales
- USD - Prelim UoM Inflation Expectations
Potential Oil Market Moves
Oil continues to consolidate inside a bullish triangle formation. The top of the triangle formation is at 76.18. If the triangle is resolved to the upside, we could see the market trading higher to the 72.33 - 80.62 range. A bearish breakout from could move the market down to 66.93.

How Would You Trade Oil Today?
I hope this Oil technical analysis helps you to make better informed trading decisions. Check the latest market analysis for other instruments and subscribe to receive them in your inbox as soon as they are published
DISCLAIMER: TIO Markets offers an exclusively execution-only service. The views expressed are for information purposes only. None of the content provided constitutes any form of investment advice. The comments are made available purely for educational and marketing purposes and do NOT constitute advice or investment recommendation (and should not be considered as such) and do not in any way constitute an invitation to acquire any financial instrument or product. TIOmarkets and its affiliates and consultants are not liable for any damages that may be caused by individual comments or statements by TIOmarkets analysis and assumes no liability with respect to the completeness and correctness of the content presented. The investor is solely responsible for the risk of his/her investment decisions. The analyses and comments presented do not include any consideration of your personal investment objectives, financial circumstances, or needs. The content has not been prepared in accordance with any legal requirements for financial analysis and must, therefore, be viewed by the reader as marketing information. TIOmarkets prohibits duplication or publication without explicit approval.

Janne Muta holds an M.Sc in finance and has over 20 years experience in analysing and trading the financial markets.
Related Posts


Trade responsibly: CFDs are complex instruments and come with a high risk of losing all your invested capital due to leverage.