Oil Technical Analysis | Lower Swing High in the Weekly Chart
BY Janne Muta
|November 1, 2023Oil technical analysis - In October, factory activity in China, the globe's top oil importer, saw an unexpected decline. Despite the dismal manufacturing data from China, some interest in the crude oil market emerged.
The Caixin China General Manufacturing PMI dropped to 49.5 in October 2023 from 50.6 the previous month, falling short of the anticipated market prediction of 50.8. Over time, this diminishing demand outlook from China has led traders to reconsider China's crude oil consumption levels.
Moreover, with the U.S. crude production hitting a monthly record of 13.05 million barrels per day in August, as stated by the Energy Information Administration (EIA), medium-term price pressures persist.
On the geopolitical front, the conflict between Israel and Hamas, although severe, is not believed to escalate throughout the broader Middle East. This has helped in stabilizing the oil prices for the time being.
However, intraday and swing traders should closely follow the upcoming Fed commentary in the press briefing today as it is highly likely to impact institutional positioning the U.S. dollar and, by extension, the price of oil.
Summary of This Oil Technical Analysis Report:
- Crude oil dropped 6.8% in 2 weeks, reaching a key confluence zone. Lower swing highs suggest market weakness. If 80.62 breaks, it may fall to 77.51-78.12. Otherwise, it could rise to $85.
- The daily chart highlights the 50% Fibonacci and 80.62 level halting the oil's decline. Today, oil recovered slightly. The oversold stochastic oscillator indicates significant support. Resistance lies at 85.55 - 85.88, formed by market structure and a 50-period average.
- The 4-hour oil chart suggests a possible breakout from a bearish trend. If successful, it may test the area below the 50-period average, with key levels at 82.83, 84.50, and 85.33. A sustainable rise beyond the 50-period average could lead to a dip below 80.48. Despite overbought indicators, readings can be unreliable when rising from major support.
Read the full oil technical analysis report below.
Oil technical analysis
Weekly Oil technical analysis
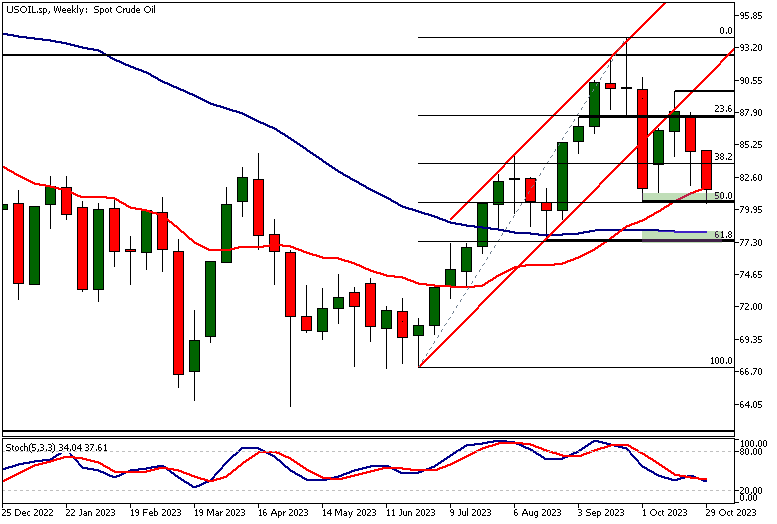
Crude oil has traded lower by 6.8% since the market created a lower reactionary high 2 weeks ago. This weakness has brought the market down to an important confluence zone where a market structure level, the 50% Fibonacci retracement level, and the 20-period moving average are somewhat closely aligned.
Lower Swing High
Oil technical analysis shows the lower swing high roughly coinciding with the bullish trend channel low. Lower swing highs often indicate that the market is weak and there could be further downside ahead.
If the 80.62 support level breaks, the market could move down to the next confluence area at 77.51-78.12. Alternatively, should the crude oil market attract buyers above the 80.62 support level, we might see it trading up to the $85 level.
Daily Dow Jones technical analysis
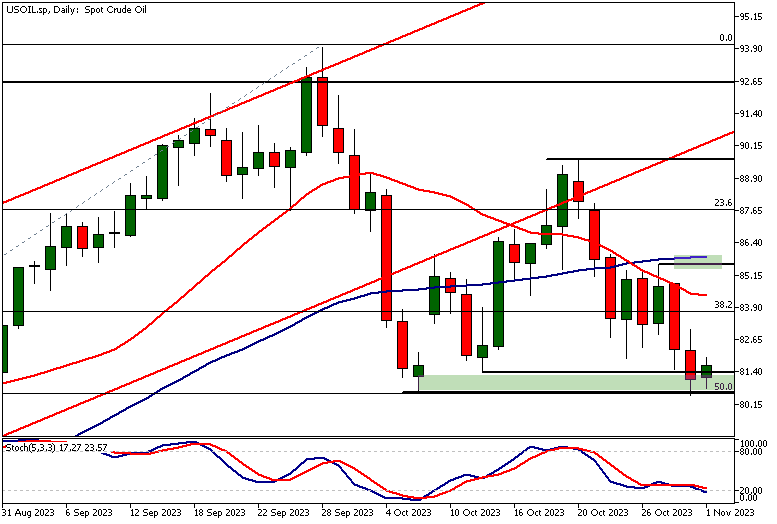
The daily time frame chart shows how the 50% Fibonacci retracement level and the 80.62 market structure level stopped the market decline yesterday. Today, we have seen the oil market recovering slightly.
The stochastic oscillator is in the oversold area, an indication that ties together with the market trading near a significant support level. The nearest major resistance area in this time frame can be found at 85.55 - 85.88. Oil technical analysis shows this confluence area is formed by a market structure level and the 50-period moving average.
Oil technical analysis, 2h chart
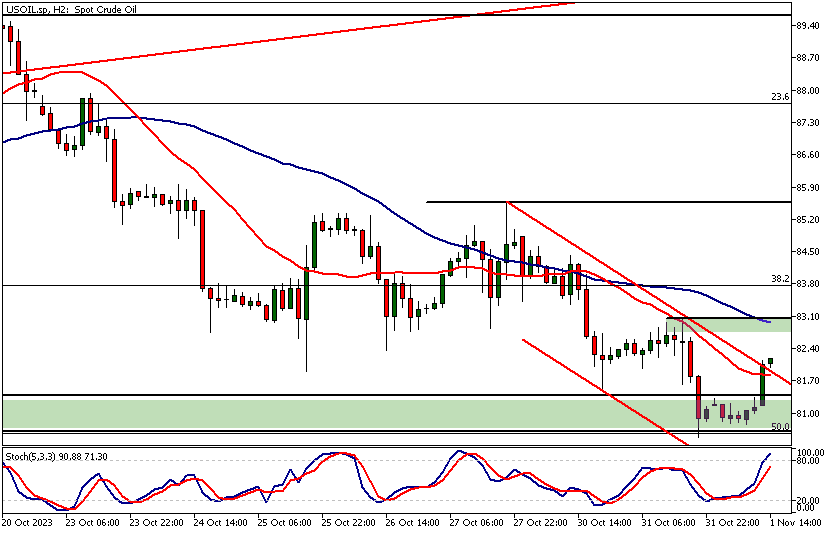
The 4-hour chart shows the crude oil market trying to break out of a bearish trend channel. If the breakout is successful and there is follow-through buying, we might see the market testing the nearest technical confluence area right below the 50-period moving average.
In addition to the moving average, this area contains a market structure level at 82.83. Our oil technical analysis suggests that above the 50-period moving average, the market could trade to 84.50 or so, and then possibly to 85.33 on extension.
The SMA(50) as a threshold
Should the crude oil bulls not be able to move the market sustainably beyond the 50-period moving average, a break below yesterday's low at 80.48 could be likely.
The indicator-based oil technical analysis shows the market in overbought condition while in a bearish trend as per the moving averages. However, we should remember that whenever the market is trading higher from a major support level, such indications are on average quite unreliable.
Client sentiment analysis
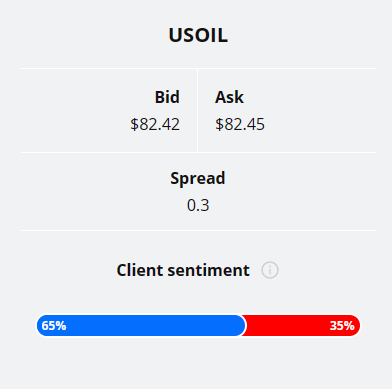
TIOmarkets' clients are bullish on oil with 65% of them currently holding long positions in the DJ, while 35% of them are short the market.
Please remember that the retail trader client sentiment is a contrarian indicator as most of the retail traders are on average betting against the market trends. This is why, experienced traders tend to trade against the retail client sentiment. You can follow the TIOmarkets client sentiment live on our Forex dashboard.
The key risk events impacting this market today:
- ISM Manufacturing PMI
- JOLTS Job Openings
- ISM Manufacturing Prices
- Federal Funds Rate
- FOMC Statement
- FOMC Press Conference

Potential Oil Market Moves
A successful breakout from the bearish trend channel on the 4-hour chart, with sustained buying, may lead to the oil market testing higher resistance levels. Overcoming the 50-period moving average could set the stage for further upside, targeting 84.50 and 85.33 levels.
The failure attract buying above the 80.62 support level, as indicated in the daily oil technical analysis, could usher in further declines towards 77.51-78.12. Additionally, lower swing highs and a potential lack of buyer interest at critical junctures may exacerbate the bearish outlook on crude oil.
How would you trade the oil today?
I hope this fundamental and technical oil analysis helps you to make better informed trading decisions. Check the latest market analysis for other instruments and subscribe to receive them in your inbox as soon as they are published
DISCLAIMER: Tio Markets offers an exclusively execution-only service. The views expressed are for information purposes only. None of the content provided constitutes any form of investment advice. The comments are made available purely for educational and marketing purposes and do NOT constitute advice or investment recommendation (and should not be considered as such) and do not in any way constitute an invitation to acquire any financial instrument or product. TIOmarkets and its affiliates and consultants are not liable for any damages that may be caused by individual comments or statements by TIOmarkets analysis and assumes no liability with respect to the completeness and correctness of the content presented. The investor is solely responsible for the risk of his/her investment decisions. The analyses and comments presented do not include any consideration of your personal investment objectives, financial circumstances, or needs. The content has not been prepared in accordance with any legal requirements for financial analysis and must, therefore, be viewed by the reader as marketing information. TIOmarkets prohibits duplication or publication without explicit approval.
Join us on social media

Janne Muta holds an M.Sc in finance and has over 20 years experience in analysing and trading the financial markets.
Related Posts


Trade responsibly: CFDs are complex instruments and come with a high risk of losing all your invested capital due to leverage.