Oil Technical Analysis | Oil falls amidst rising global supply
BY Janne Muta
|December 13, 2023Oil Technical Analysis - Oil prices dipped in the Asian session, pressured by increasing supply indications. Russia's weekly seaborne crude exports has reached a peak since early July, as noted by ANZ Research analysts. The U.S. Energy Information Administration (EIA) also raised its 2023 U.S. crude supply forecast in its latest report, contributing to a further drop in oil prices.
Market dynamics were further shaken by the slightly stronger-than-expected U.S. November inflation data, suggesting the Federal Reserve might not lower interest rates soon, which could affect consumption. This situation is exacerbated by Russia's rising crude exports, challenging the recent OPEC+ output cut agreement's effectiveness.
Furthermore, according to Reuters Canada's and Brazil's oil production is on the rise, with Canada expecting a 10% increase next year. Investors are now awaiting forthcoming monthly market reports from the International Energy Agency (IEA) and OPEC for further market insights.
Summary of This Oil Technical Analysis Report:
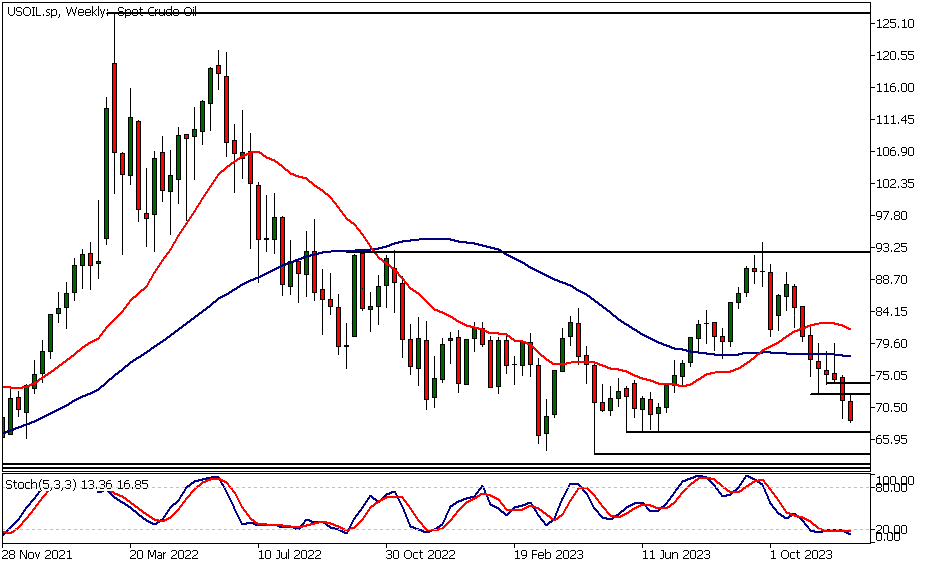
- Crude oil's eighth consecutive weekly decline, losing over 21%, approaches support at 66.93, potentially dropping to 63.86. Resistance at 72.33 and 73.82 could lead to a rally, but mixed moving averages indicate an uncertain trend.
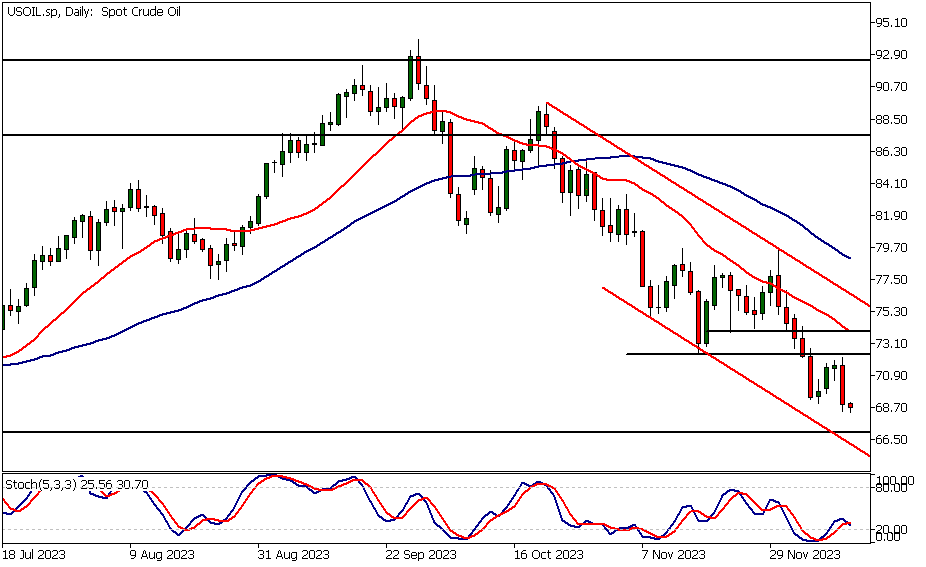
- Daily, oil shows a bearish trend in a descending channel with SMA(20) below SMA(50). Resistance levels at 72.33 and 73.82 are critical; a break above could signal a shift, but the prevailing sentiment remains bearish.
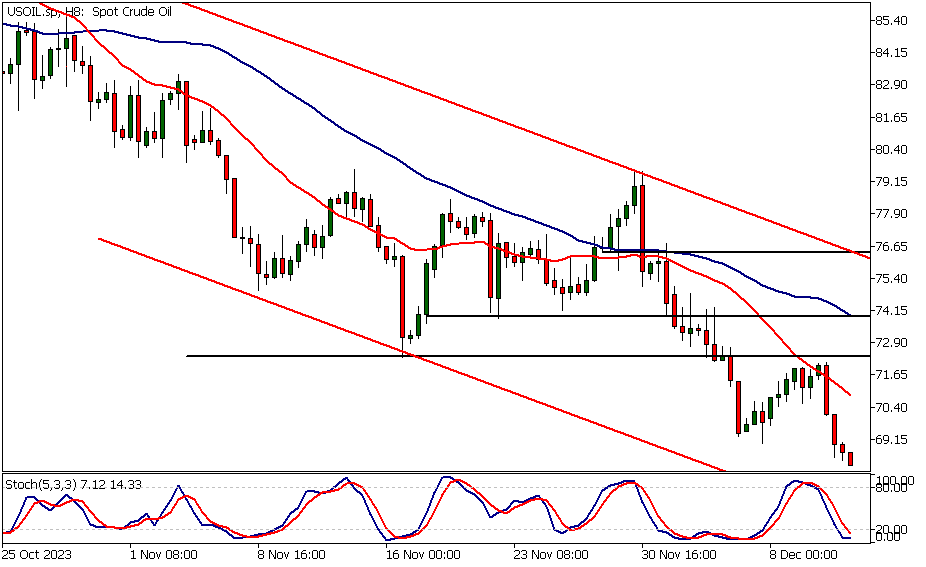
- Intraday analysis reveals a strong bearish bias in USOIL with SMA(20) as resistance and failed rallies. Key resistance at 72.33 and 73.82, coupled with SMA(50), suggests the trend may continue, despite an oversold Stochastic Oscillator.
Read the full Oil Technical Analysis report below.
Oil Technical Analysis

Weekly Oil Technical Analysis
The crude oil market is falling for the eighth consecutive week. The market has lost over 21% over this period and is now approaching a weekly support level at 66.93. The next support level below this can be found at 63.86. Oil technical analysis suggests that the market could move into this range before the fall in the price can be halted.
The nearest key resistance area is created by market structure levels at 72.33 and 73.82. Should the market rally, this area could be targeted by swing traders, thus producing more supply and possibly turning the market lower again. Moving averages provide mixed signals with the SMA(20) above the SMA(50), but the slow moving average pointing slightly lower. This indicates a lack of trend in this timeframe.

Daily Oil Technical Analysis
Oil is trending lower in a descending trend channel with the moving averages pointing lower. The SMA(20) is below the SMA(50), and the market is well below the SMA(20), indicating a bearish market regime. The latest rally failure happened below the 72.33 level, underlining the level's significance as a resistance.
Technical confluence
Note how the SMA(20) coincides with the next market structure level at 73.82, adding to its technical significance. If there were a rally above this market structure area, the oil bulls could face more supply at the descending trend channel top (currently at 76.45). Based on this oil technical analysis, the market bias remains bearish.

Intraday Oil Technical Analysis
The 8h chart shows how the SMA(20) acted as resistance, and the latest contra-trend rally failed. If the market were able to rally above the SMA(20) and the nearest key resistance level (72.33), the 73.82 level could come into play. The SMA(50) creates a technical confluence at this level.
The slower moving average points down with the faster SMA below it, providing an indication that the bearish trend is strong. Even though the Stochastic Oscillator is in the oversold area, oil technical analysis indicates that the bearish bias remains strong, thus nullifying the oscillator indication.

Client sentiment analysis
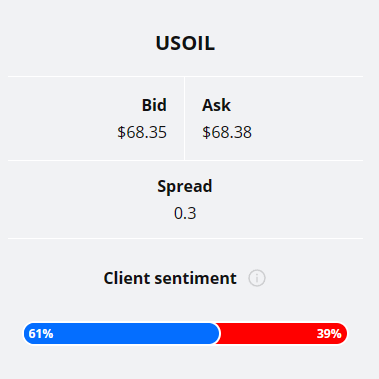
TIOmarkets' clientele are bullish on USOIL, with 61% of clients holding long positions and 39% shorting the market.
Please remember that the retail trader client sentiment is a contrarian indicator as most of the retail traders are on average betting against the market trends. This is why, experienced traders tend to trade against the retail client sentiment. You can follow the TIOmarkets client sentiment live on our Forex dashboard.
The next key risk events impacting this market
- Core PPI m/m
- PPI m/m
- Crude Oil Inventories
- Federal Funds Rate
- FOMC Economic Projections
- FOMC Statement
- FOMC Press Conference
- Core Retail Sales m/m
- Retail Sales m/m
- Unemployment Claims
Potential Oil Market Moves
The market is now approaching a weekly support level at 66.93 with the next support level below this to be found at 63.86. Oil technical analysis suggests that the market could move into this range before the fall in the price can be halted.
The nearest key resistance area is created by market structure levels at 72.33 and 73.82. Should the market rally, this area could be targeted by swing traders, thus producing more supply and possibly turning the market lower again.

How Would You Trade Oil Today?
I hope this Oil technical analysis helps you to make better informed trading decisions. Check the latest market analysis for other instruments and subscribe to receive them in your inbox as soon as they are published
DISCLAIMER: TIO Markets offers an exclusively execution-only service. The views expressed are for information purposes only. None of the content provided constitutes any form of investment advice. The comments are made available purely for educational and marketing purposes and do NOT constitute advice or investment recommendation (and should not be considered as such) and do not in any way constitute an invitation to acquire any financial instrument or product. TIOmarkets and its affiliates and consultants are not liable for any damages that may be caused by individual comments or statements by TIOmarkets analysis and assumes no liability with respect to the completeness and correctness of the content presented. The investor is solely responsible for the risk of his/her investment decisions. The analyses and comments presented do not include any consideration of your personal investment objectives, financial circumstances, or needs. The content has not been prepared in accordance with any legal requirements for financial analysis and must, therefore, be viewed by the reader as marketing information. TIOmarkets prohibits duplication or publication without explicit approval.

Janne Muta holds an M.Sc in finance and has over 20 years experience in analysing and trading the financial markets.
Related Posts
Trade responsibly: CFDs are complex instruments and come with a high risk of losing all your invested capital due to leverage.


