Oil Technical Analysis | Will OPEC production cuts lift the market?
BY Janne Muta
|November 20, 2023Oil technical analysis - Profit-taking after a 7-week decline in oil prices helped US oil rally higher on Friday, and that move has continued today. The risk sentiment was aided by US sanctions on Russian oil shippers but the main driver for speculative buying was a rumour that OPEC is considering further supply cuts to stabilize oil prices.
Short covering and speculative buying have at the time of writing resulted in a 7.6% rally since last week's low. OPEC+ is scheduled to meet on November 26 to consider these additional supply cuts.
USOIL bounced higher from a bottoming formation the market had created in May and June this year. This resulted in a rejection candle in the weekly chart and suggests the market is either getting ready to rally or could be consolidating before the next directional move takes place.
It wouldn't be surprising if there was a period of consolidation as the market declined 23% from the September high to the low established last week.
Summary of This Oil Technical Analysis Report:
- USOIL bounced higher from a bottoming formation the market had created in May and June this year. This resulted in a rejection candle in the weekly chart and suggests the market is either getting ready to rally or could be consolidating before the next directional move takes place.
- The daily chart shows how the oil is trading at the upper end of the bearish trend channel (77.60). Should it be able to move above this diagonal resistance, the next resistance area created by two market structure levels at 79.63 and 80.62 could be tested.
- The two-hour chart shows the nearest key support levels at 75.41 and 76.21. The higher support level coincides with the 50-period moving average, while the lower is closely aligned with the 20-period moving average.
Read the full Oil Technical Analysis report below.
Oil Technical Analysis
Weekly Oil Technical Analysis
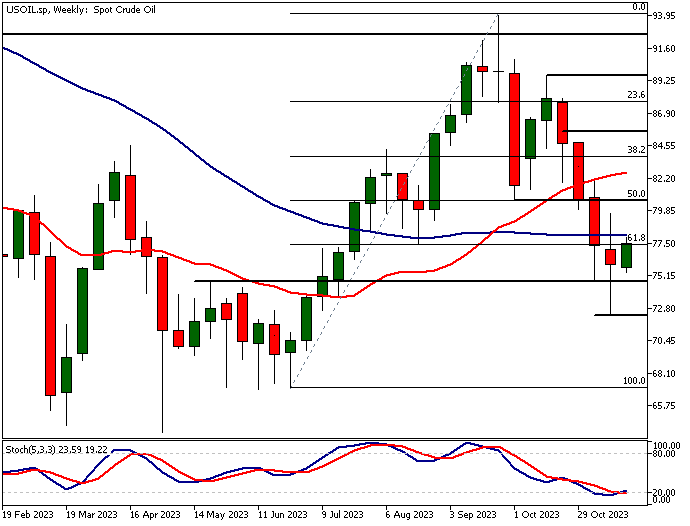
USOIL bounced higher from a bottoming formation the market had created in May and June this year. This resulted in a rejection candle in the weekly chart and suggests the market is either getting ready to rally or could be consolidating before the next directional move takes place.
It wouldn't be surprising if there was a period of consolidation, as the market declined 23% from the September high to the low established last week.
Indicator-based oil technical analysis suggests the market is oversold, with the stochastic oscillator near the oversold territory. The moving averages are currently in a bullish order, with the 20-period above the 50-period moving average, but the market is trading below the SMA(50).
The nearest key support level in the weekly timeframe is last week's low at 72.33. If the market can reverse the downtrend above this level, we could see it trading to 83.50. Below 72.33, a move down to 70.00 could be likely.
Daily Oil Technical Analysis
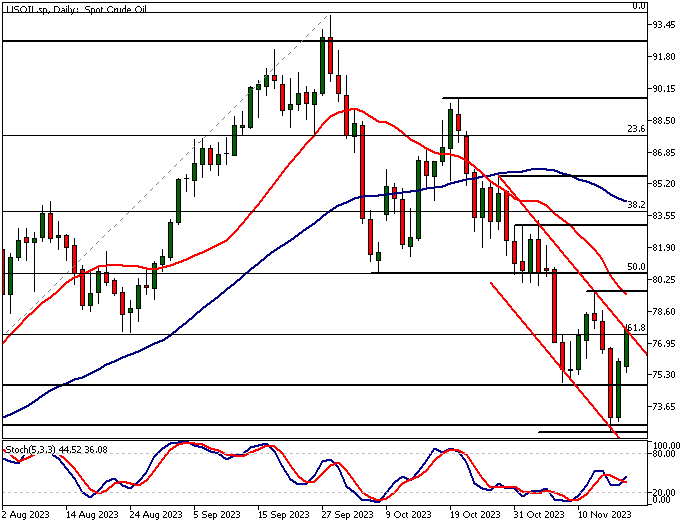
The daily chart shows how the oil is trading at the upper end of the bearish trend channel (77.60). Should it be able to move above this diagonal resistance, the next resistance area created by two market structure levels at 79.63 and 80.62 could be tested.
Oil technical analysis shows that this range coincides with the 20-period moving average and could therefore be a significant resistance. Alternatively, below 77.60 (the bear channel high), we might see a move to 75.50 and then perhaps to levels near last week's low at 72.33.
Oil Technical Analysis, 2h
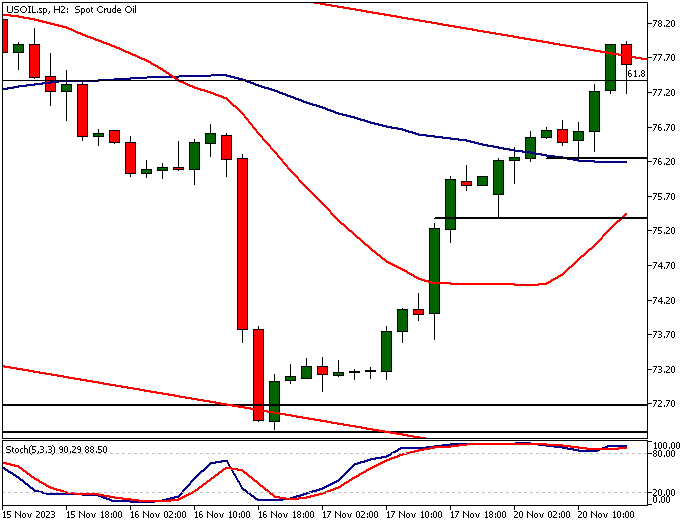
The 4-hour chart shows the nearest key support levels at 75.41 and 76.21. The higher support level coincides with the 50-period moving average, while the lower is closely aligned with the 20-period moving average.
Our oil technical analysis indicates that should there be a decline to these levels, traders should monitor price action to see whether there are signs of buying re-emerging at these price levels.
Client sentiment analysis
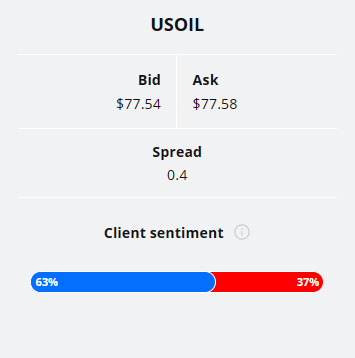
TIOmarkets' clientele are mildly bullish on USOIL, with 63% of clients holding long positions and only 37% shorting the market.
Please remember that the retail trader client sentiment is a contrarian indicator as most of the retail traders are on average betting against the market trends. This is why, experienced traders tend to trade against the retail client sentiment. You can follow the TIOmarkets client sentiment live on our Forex dashboard.
The next key risk events impacting this market:
US Existing Home Sales
US FOMC Meeting Minutes
US Unemployment Claims
US Core Durable Goods Orders m/m
US Durable Goods Orders m/m
US- Revised UoM Consumer Sentiment
Crude Oil Inventories
US Flash Manufacturing PMI
US Flash Services PMI

Potential Oil Market Moves
The daily chart shows how the oil is trading at the upper end of the bearish trend channel (77.60). Should it be able to move above this diagonal resistance, the next resistance area created by two market structure levels at 79.63 and 80.62 could be tested.
Oil technical analysis shows that this range coincides with the 20-period moving average and could therefore be a significant resistance. Alternatively, below 77.60 (the bear channel high), we might see a move to 75.50 and then perhaps to levels near last week's low at 72.33.
How would you trade the Oil today?
I hope this Oil technical analysis helps you to make better informed trading decisions. Check the latest market analysis for other instruments and subscribe to receive them in your inbox as soon as they are published
DISCLAIMER: TIO Markets offers an exclusively execution-only service. The views expressed are for information purposes only. None of the content provided constitutes any form of investment advice. The comments are made available purely for educational and marketing purposes and do NOT constitute advice or investment recommendation (and should not be considered as such) and do not in any way constitute an invitation to acquire any financial instrument or product. TIOmarkets and its affiliates and consultants are not liable for any damages that may be caused by individual comments or statements by TIOmarkets analysis and assumes no liability with respect to the completeness and correctness of the content presented. The investor is solely responsible for the risk of his/her investment decisions. The analyses and comments presented do not include any consideration of your personal investment objectives, financial circumstances, or needs. The content has not been prepared in accordance with any legal requirements for financial analysis and must, therefore, be viewed by the reader as marketing information. TIOmarkets prohibits duplication or publication without explicit approval.

Janne Muta holds an M.Sc in finance and has over 20 years experience in analysing and trading the financial markets.
Related Posts


Trade responsibly: CFDs are complex instruments and come with a high risk of losing all your invested capital due to leverage.