S&P 500 Technical Analysis | Be ready to trade the US inflation data release!
BY Janne Muta
|November 14, 2023S&P 500 Technical Analysis - The widely anticipated Consumer Price Index (CPI) report today is expected to show a slight decrease in headline inflation, while core inflation is projected to remain steady, according to analysts. If inflation figures come in below expectations, it could bolster the S&P 500 index, particularly benefiting technology stocks due to their significant representation in the index.
The market has been quite data-dependent lately as several Fed officials have suggested that the central bank has not done enough to fight inflation and more rate hikes could be needed. Last week the market moved sideways from Monday to Thursday and then rallied on worse than expected consumer sentiment data on Friday.
This trend suggests a resurgence of the mindset where bad news boosts stock prices, driven by speculation that the Fed might hold back on interest rate hikes. Consequently, today's inflation and retail sales data are crucial as they could significantly influence market sentiment in the upcoming days.
Summary of this S&P 500 technical analysis report:
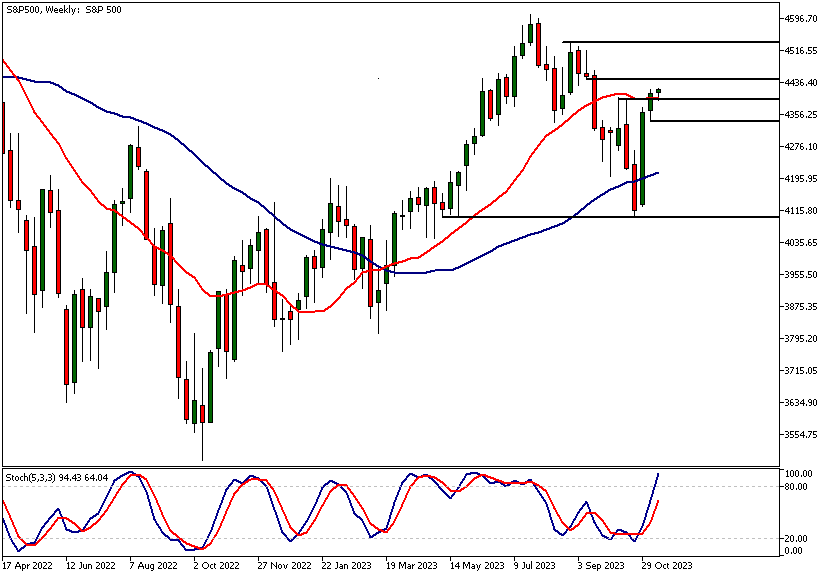
- The weekly chart shows the S&P 500 continuing the rally last week. The latest move has taken the market above the October highs and relatively close to a market structure level (4444) that supported the S&P 500 in September.
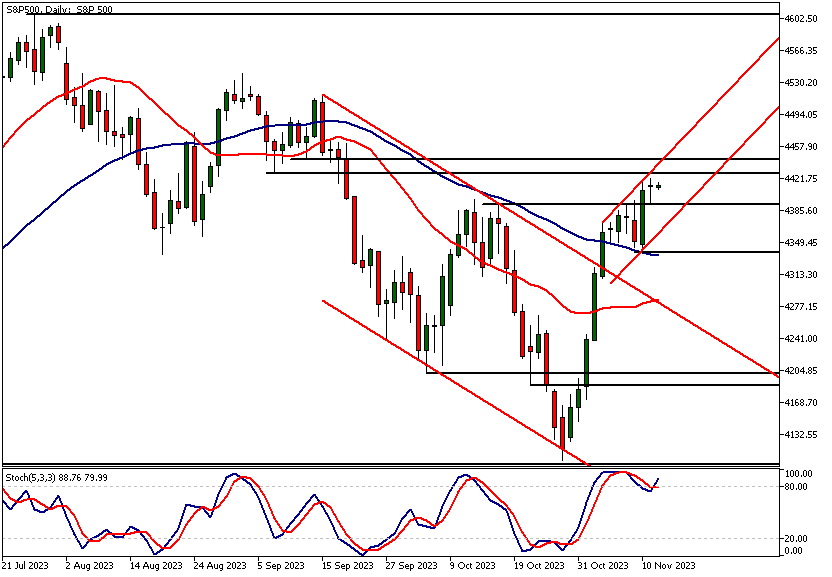
- The S&P 500 continued to rally on Friday after the market had corrected slightly lower. This correction was stopped by the 50-period moving average, and the bulls pushed the market strongly higher.
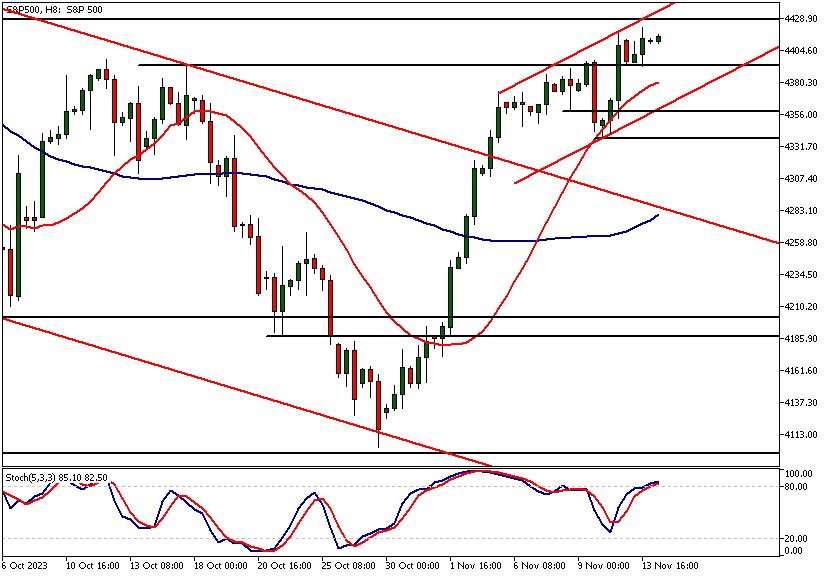
- In the 8-hour chart, the market is trending higher inside a bullish trend channel, with the 20-period SMA below the current market price and pointing higher. The moving average is above the 50-period SMA, indicating an uptrend.
Read the full S&P 500 technical analysis report below.
S&P 500 technical analysis
Weekly S&P 500 technical analysis
The weekly chart shows the S&P 500 continuing the rally last week. The latest move has taken the market above the October highs and relatively close to a market structure level (4444) that supported the S&P 500 in September.
The risk of a correction has increased after a move to an area like this. In fact, we saw the market trading sideways yesterday in the daily chart. Our S&P 500 technical analysis therefore suggests that the market participants are cautious ahead of the US inflation report, so we also need to focus on the CPI data and especially the subsequent price reaction.
Daily S&P 500 technical analysis
The S&P 500 continued to rally on Friday after the market had corrected slightly lower. This correction was stopped by the 50-period moving average, and the bulls pushed the market strongly higher. It's interesting that last week's up move was practically down to a one-day performance.
This suggests that the S&P 500's sideways movement earlier in the week reflects market uncertainty, while the rally after the data release suggests that cooling consumer sentiment could lead to less aggressive rate hikes from the Fed.
Key technical price levels
Yesterday the market paused again, as traders and investors alike were waiting for today's inflation data release. S&P 500 technical analysis shows the nearest key support level at 4339, while the nearest market structure level above the current market price is at 4444.
In the daily chart, the market remains bullish above the 4339 swing low. Above the level, the market might move to 4466. Below 4339, we could see a move to 4320.
Yesterday's narrow-range candle, however, serves as a reminder that the market has rallied quite strongly and could be vulnerable if the CPI reading comes in significantly higher than expected.
S&P 500 technical analysis, 8h
In the 8-hour chart, the market is trending higher inside a bullish trend channel, with the 20-period SMA below the current market price and pointing higher. The moving average is above the 50-period SMA, indicating an uptrend.
Potential buy area
The S&P 500 technical analysis shows the nearest key support level is at 4393. Below the level, the 4359 region might attract buyers. This market structure level (4359) roughly coincides with the bullish trend channel low and, as such, could serve as a reference point for those looking for a potential long entry area. If the market breaks the 4340 support level, we could see it trading down to 4320.
Client sentiment analysis
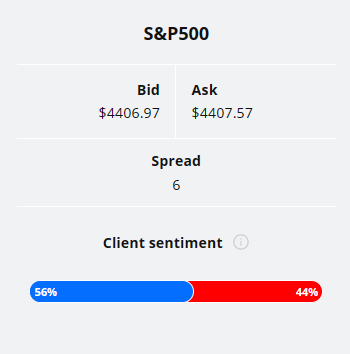
The TIOmarkets client sentiment graph shows that traders as a whole aren't strongly committed to either side of the market. 56% of traders are long and 44% are short the market.
Please remember that the retail trader client sentiment is a contrarian indicator as most of the retail traders are on average betting against the market trends. This is why, experienced traders tend to trade against the retail client sentiment. You can follow the TIOmarkets client sentiment live on our Forex dashboard.
The next key risk events impacting this market:
- CPI
- Empire State Manufacturing Index
- PPI
- Retail Sales
- Unemployment Claims
Potential S&P 500 Market Moves
In the daily chart, the market remains bullish above the 4339 swing low. Above the level, the market might move to 4466. Below 4339, we could see a move to 4320.

How would you trade the S&P 500 today?
I hope this S&P 500 technical analysis report helps you to make better informed trading decisions. Check the latest market analysis for other instruments and subscribe to receive them in your inbox as soon as they are published
DISCLAIMER: TIO Markets offers an exclusively execution-only service. The views expressed are for information purposes only. None of the content provided constitutes any form of investment advice. The comments are made available purely for educational and marketing purposes and do NOT constitute advice or investment recommendation (and should not be considered as such) and do not in any way constitute an invitation to acquire any financial instrument or product. TIOmarkets and its affiliates and consultants are not liable for any damages that may be caused by individual comments or statements by TIOmarkets analysis and assumes no liability with respect to the completeness and correctness of the content presented. The investor is solely responsible for the risk of his/her investment decisions. The analyses and comments presented do not include any consideration of your personal investment objectives, financial circumstances, or needs. The content has not been prepared in accordance with any legal requirements for financial analysis and must, therefore, be viewed by the reader as marketing information. TIOmarkets prohibits duplication or publication without explicit approval.

Janne Muta holds an M.Sc in finance and has over 20 years experience in analysing and trading the financial markets.
Related Posts


Trade responsibly: CFDs are complex instruments and come with a high risk of losing all your invested capital due to leverage.