S&P 500 Technical Analysis | Black Friday boosts positive outlook for equities
BY Janne Muta
|November 28, 2023S&P 500 Technical Analysis - US equity indices paused their robust rally yesterday with the S&P 500 drifting marginally lower (-0.2%). Despite this dip, the index is still on course for one of the most impressive monthly gains in over a year. This market optimism is largely fuelled by investors' belief that the Federal Reserve's interest rate hikes will sufficiently cool the U.S. economy to curb inflation without triggering a recession.
Fed funds futures traders are betting there will be four rate cuts for 2024, starting from June. Futures are pricing in a 72.8% chance of a Federal Reserve rate cut for the 12 June 2024 meeting, with a 42.8% probability the cut will be 25 basis points, adjusting the target rate from 525-550 bps to 500-525 bps.
Furthermore, the WSJ reports early indicators pointing to a robust Black Friday shopping season. US retail sales on Black Friday jumped by 2.5% from the previous year, and physical store traffic also saw an increase. Notably, Shopify reported a 22% surge in Black Friday sales and Amazon observed a 20% increase in online spending due to buy-now-pay-later transactions.
In yesterday's trading eight of the ten S&P 500 sectors lost some ground while only three sectors gained slightly. The losses however were minor with cyclical sectors declining only modestly. This suggests that despite the lack of momentum in yesterday's trading risk sentiment remains strong.
Summary of this S&P 500 technical analysis report:
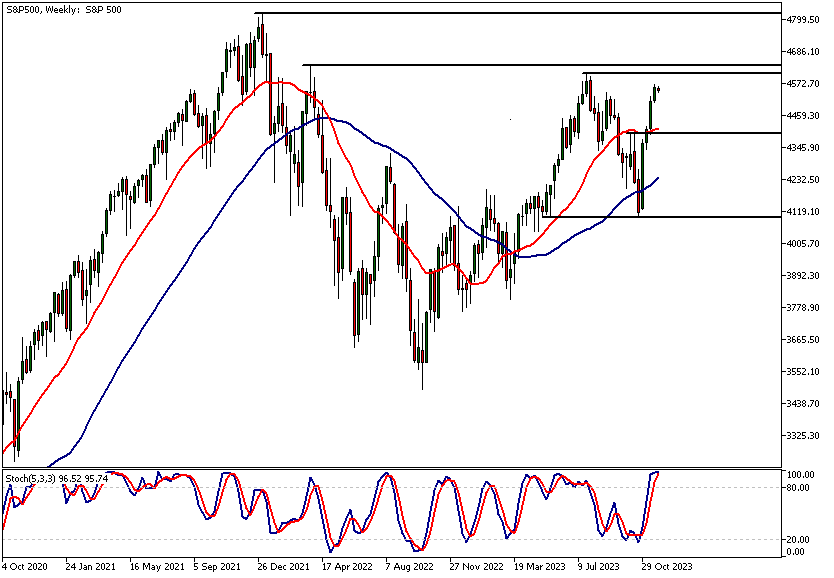
- The weekly chart shows the S&P 500 approaching a critical market structure area between the July high at 4606.75 and the March 2022 high at 4637.75. If the market is able to decisively rally above this resistance area, we could eventually see a move to around 4780. Alternatively, should there be too much supply for the bulls to absorb, the market could retrace back to the 20-period moving average (currently at 4410).
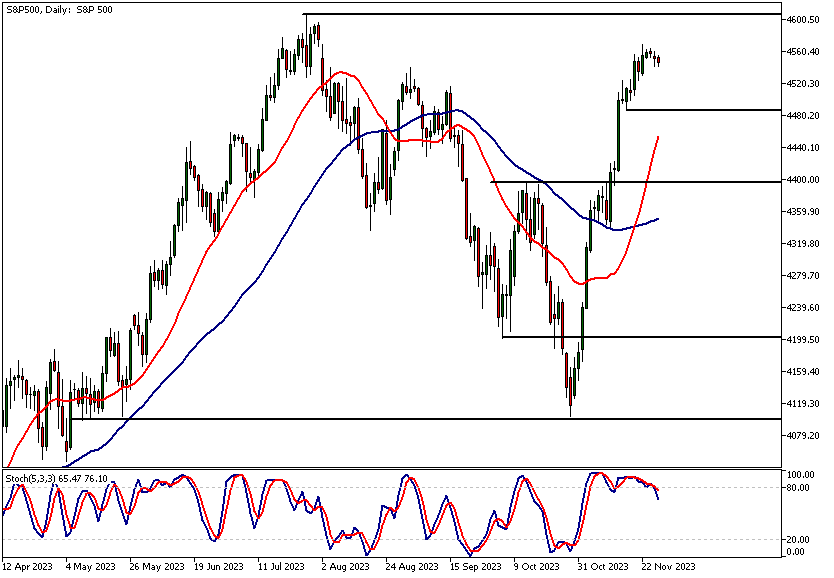
- After rallying over 11% since the October low, the market is now trading only 1.4% away from the July high at 4606.75. The market remains bullish above the nearest minor daily timeframe support level, which is at 4487.32, and could be targeting the July high (4606.75).
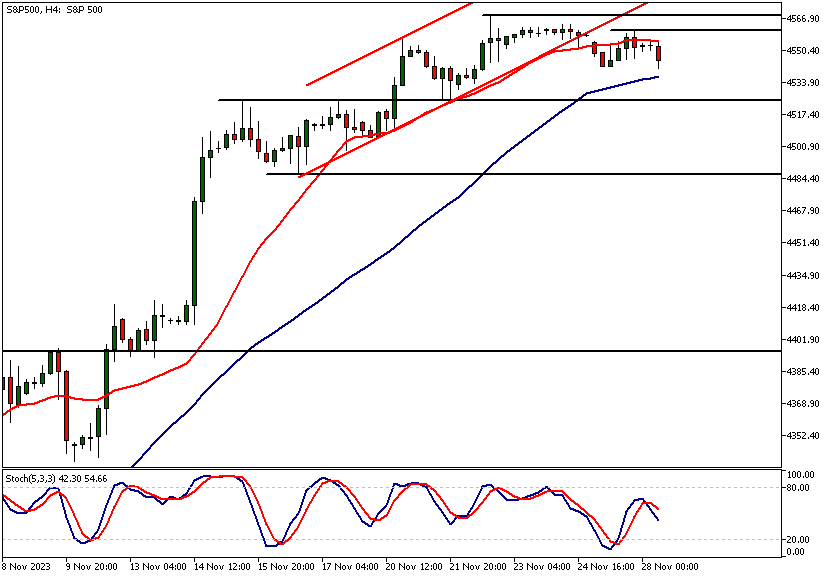
- In the 4-hour chart, the market has moved below the bull channel low. It has also potentially created a lower swing high, suggesting that we could see the market trading down to the next key support level at 4524.40. Should the market fail to attract buyers at this level, we could see it moving down to around 4506, and then possibly to 4495.
Read the full S&P 500 technical analysis report below.
S&P 500 technical analysis
Weekly S&P 500 technical analysis
The weekly chart shows the S&P 500 approaching a critical market structure area between the July high at 4606.75 and the March 2022 high at 4637.75. If the market is able to decisively rally above this resistance area, we could eventually see a move to around 4780.
Alternatively, should there be too much supply for the bulls to absorb, the market could retrace back to the 20-period moving average (currently at 4410).
Oscillator indications
Indicator-oriented S&P 500 technical analysis shows both of the moving averages pointing higher, with the 20-period SMA above the 50-period SMA. At the same time, the stochastic oscillator is deeply in the overbought zone, with the current value at 96.25. This indicates that the market is strongly bullish, but the rally could soon slow down.
Daily S&P 500 technical analysis
After rallying over 11% since the October low, the market is now trading only 1.4% away from the July high at 4606.75. The market remains bullish above the nearest minor daily timeframe support level, which is at 4487.32, and could be targeting the July high (4606.75).
Alternatively, below this level, we could see the market trading down to 4450. The nearest major market structure level can be found at 4324.84.
Indicator-based S&P 500 technical analysis supports the bullish view, with the market trading well above the 20-period SMA. The moving average also points higher and is above the 50-period SMA.
S&P 500 technical analysis, 4h
In the 4-hour chart, the market has moved below the bull channel low. It has also potentially created a lower swing high, suggesting that we could see the market trading down to the next key support level at 4524.40.
Alternative scenario
Should the market fail to attract buyers at this level, we could see it moving down to around 4506, and then possibly to 4495.
Indicator-based S&P 500 technical analysis suggests the market remains relatively strong, even though it has lost some upside momentum. The market is now trading between the 20-period moving average and the 50-period moving average. The moving averages are also contracting slightly, with the 20-period SMA moving closer to the 50-period SMA.
Client sentiment analysis
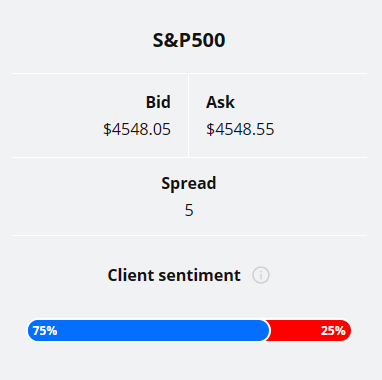
The TIOmarkets client sentiment graph shows that traders as a whole are strongly bullish on S&P 500 with 75% of traders long and 25% short the market.
Please remember that the retail trader client sentiment is a contrarian indicator as most of the retail traders are on average betting against the market trends. This is why, experienced traders tend to trade against the retail client sentiment. You can follow the TIOmarkets client sentiment live on our Forex dashboard.
The next key risk events impacting this market:
- US S&P/CS Composite-20 HPI
- US CB Consumer Confidence
- US Richmond Manufacturing Index
- US FOMC Member Waller Speaks
- US Prelim GDP
- US Prelim GDP Price Index
- US Core PCE Price Index m/m
- US Unemployment Claims
- US Chicago PMI
- US Pending Home Sales
- US ISM Manufacturing PMI
- US ISM Manufacturing Prices
- US Fed Chair Powell Speaks
Potential S&P 500 Market Moves
The market remains bullish above the nearest minor daily timeframe support level, which is at 4487.32, and could be targeting the July high (4606.75). Alternatively, below this level, we could see the market trading down to 4450. The nearest major market structure level can be found at 4324.84.

How would you trade the S&P 500 today?
I hope this S&P 500 technical analysis report helps you to make better informed trading decisions. Check the latest market analysis for other instruments and subscribe to receive them in your inbox as soon as they are published
DISCLAIMER: TIO Markets offers an exclusively execution-only service. The views expressed are for information purposes only. None of the content provided constitutes any form of investment advice. The comments are made available purely for educational and marketing purposes and do NOT constitute advice or investment recommendation (and should not be considered as such) and do not in any way constitute an invitation to acquire any financial instrument or product. TIOmarkets and its affiliates and consultants are not liable for any damages that may be caused by individual comments or statements by TIOmarkets analysis and assumes no liability with respect to the completeness and correctness of the content presented. The investor is solely responsible for the risk of his/her investment decisions. The analyses and comments presented do not include any consideration of your personal investment objectives, financial circumstances, or needs. The content has not been prepared in accordance with any legal requirements for financial analysis and must, therefore, be viewed by the reader as marketing information. TIOmarkets prohibits duplication or publication without explicit approval.

Janne Muta holds an M.Sc in finance and has over 20 years experience in analysing and trading the financial markets.
Related Posts


Trade responsibly: CFDs are complex instruments and come with a high risk of losing all your invested capital due to leverage.