S&P 500 Technical Analysis | Bullish momentum slows as market nears the July high
BY Janne Muta
|December 6, 2023S&P 500 Technical Analysis - S&P 500 traded sideways in yesterday's session while the bond market maintained its rally, driving yields on the benchmark 10-year U.S. notes to their lowest levels since October.
Consequently, the tech-focused Nasdaq Composite experienced a slight gain (+0.3%), while both the S&P 500 and the Dow Jones Industrial Average witnessed marginal declines. Nasdaq's performance was bolstered by significant technology stocks, particularly Apple, which surged to a point where the company's market value now exceeds $3 trillion.
Nine out of the eleven S&P 500 sectors lost ground yesterday with the energy sector (-1.75%) leading the losses as the price of oil continued to slide. Only the technology (+0.60%) and consumer discretionary (+0.18%) sectors gained slightly. Declining stocks outnumbered the advancing stocks on the NYSE by a ratio of 2.3.
Job openings for October continued to decline, dropping by 617K to 8.733 million, the lowest level since March 2021. This indicates a cooling labour market. However, at the same time, the ISM Services PMI presents a more positive outlook for the job market. The Services PMI for November increased to 52.7, surpassing expectations and indicating stronger growth in the services sector.
The sector's consistent new orders and recovering inventories suggest sustained demand and improved inventory management. Although there has been a slight easing of price pressures, challenges such as inflation, interest rates, and geopolitical issues persist, along with rising labour costs and constraints.
Summary of this S&P 500 technical analysis report:
- Market is approaching the July high (4606.75). Should the market continue to attract buyers above this resistance, a move towards 4640 appears feasible. However, our S&P 500 technical analysis indicates that if the market fails to decisively break above 4606.75, we could see a retraction to 4495, and potentially to 4460 as an extension.
- Yesterday's analysis of the S&P 500 daily chart reveals that the day's low was higher than the previous one, which in turn was above the 4536 support level. This pattern suggests the presence of buying pressure, despite the proximity to the July high of 4606.75.
- In the intraday view, the market continues its overall uptrend but has shown a reduction in upward momentum over the past few days, as indicated by the contraction in moving averages.
Read the full S&P 500 technical analysis report below.
S&P 500 technical analysis

Weekly S&P 500 technical analysis
The S&P 500 index has rallied strongly, surging approximately 12% in just five weeks, before declining slightly this week. This hesitation is due to the market approaching a major resistance level—the July high of 4606.75. Note that the next weekly resistance level is relatively close by at 4637.75.
Should the market continue to attract buyers above July high, a move towards 4640 or so appears feasible. However, our S&P 500 technical analysis indicates that if the market fails to decisively break above 4606.75, we could see a retraction to 4495, and potentially to 4460 as an extension.

Daily S&P 500 technical analysis
Yesterday's analysis of the S&P 500 daily chart reveals that the day's low was higher than the previous one, which in turn was above the 4536 support level. This pattern suggests the presence of buying pressure, despite the proximity to the July high of 4606.75. The moving averages-based S&P 500 technical analysis remains bullish, with the SMA(20) trading above the SMA(50), and the market itself positioned above the fast SMA.
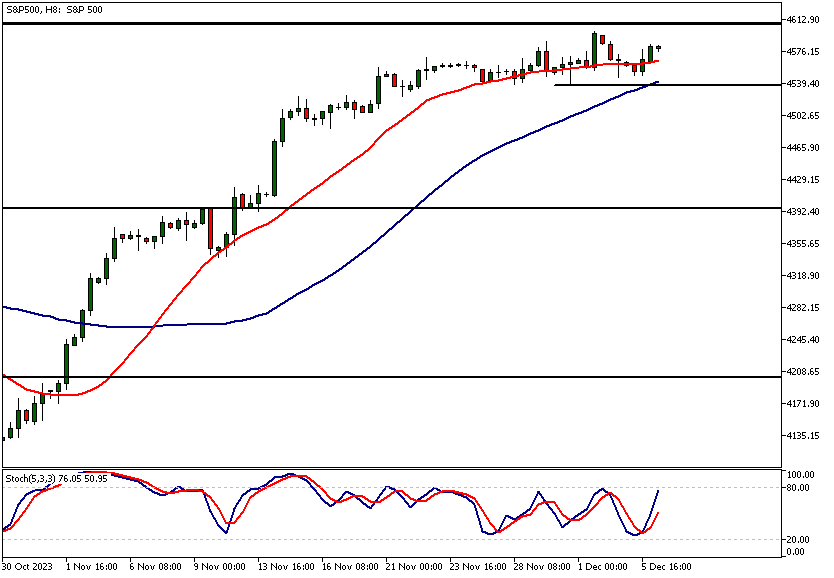
S&P 500 technical analysis, 8h
In the intraday view, the market continues its overall uptrend but has shown a reduction in upward momentum over the past few days, as indicated by the contraction in moving averages.
S&P 500 technical analysis highlights the market's sideways movement above the minor support level at 4536, while the July high looms nearby at 4606.75. A break below the 4536 level could lead to a downturn towards 4495. Conversely, maintaining above this level might see traders aiming for the 4600 mark.
Client sentiment analysis
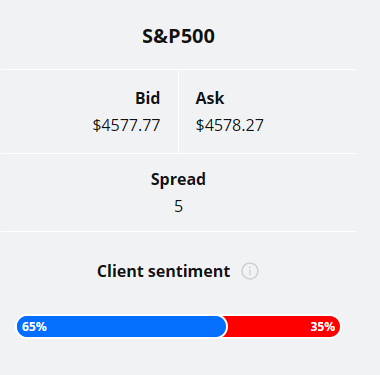
The TIOmarkets client sentiment graph shows that traders as a whole are bullish on S&P 500 with 65% of traders long and 35% short the market.
Please remember that the retail trader client sentiment is a contrarian indicator as most of the retail traders are on average betting against the market trends. This is why, experienced traders tend to trade against the retail client sentiment. You can follow the TIOmarkets client sentiment live on our Forex dashboard.
The next key risk events impacting this market:
- USD - ADP Non-Farm Employment Change
- USD - Unemployment Claims
- USD - Average Hourly Earnings
- USD - Non-Farm Employment Change
- USD - Unemployment Rate
- USD - Prelim UoM Consumer Sentiment
- USD - Prelim UoM Inflation Expectations
Potential S&P 500 Market Moves
Should the market continue to attract buyers above July high (4606.75), a move towards 4640 appears feasible. However, our S&P 500 technical analysis indicates that if the market fails to decisively break above 4606.75, we could see a retraction to 4495, and potentially to 4460 as an extension.

How would you trade the S&P 500 today?
I hope this S&P 500 technical analysis report helps you to make better informed trading decisions. Check the latest market analysis for other instruments and subscribe to receive them in your inbox as soon as they are published
DISCLAIMER: TIO Markets offers an exclusively execution-only service. The views expressed are for information purposes only. None of the content provided constitutes any form of investment advice. The comments are made available purely for educational and marketing purposes and do NOT constitute advice or investment recommendation (and should not be considered as such) and do not in any way constitute an invitation to acquire any financial instrument or product. TIOmarkets and its affiliates and consultants are not liable for any damages that may be caused by individual comments or statements by TIOmarkets analysis and assumes no liability with respect to the completeness and correctness of the content presented. The investor is solely responsible for the risk of his/her investment decisions. The analyses and comments presented do not include any consideration of your personal investment objectives, financial circumstances, or needs. The content has not been prepared in accordance with any legal requirements for financial analysis and must, therefore, be viewed by the reader as marketing information. TIOmarkets prohibits duplication or publication without explicit approval.

Janne Muta holds an M.Sc in finance and has over 20 years experience in analysing and trading the financial markets.
Related Posts


Trade responsibly: CFDs are complex instruments and come with a high risk of losing all your invested capital due to leverage.