S&P 500 Technical Analysis | Is the rally over?
BY Janne Muta
|January 4, 2024S&P 500 Technical Analysis - Wednesday saw the S&P 500 drop 0.8%, with similar declines in the Nasdaq Composite and Dow Jones Industrial Average. This downturn signals uncertainty in early 2024, following a late 2023 rally. Investors are now focused on whether the Federal Reserve will cut interest rates as initially expected.
Federal Reserve officials have indicated the end of the rate-increase cycle that started in 2022, with potential rate cuts in 2024, though no definitive schedule has been set. The market is now highly responsive to economic data, given the gap between expectations and the Federal Reserve's signals.
The Fed's December minutes highlighted a debate on U.S. monetary policy, particularly about high interest rates and balance sheet reduction. While Chairman Powell suggested an end to rate hikes and potential rate cuts by the end of 2024, the Fed remains cautious about overly tight policies amid fluctuating inflation and geopolitical concerns.
Markets show mixed responses, with some expecting rate cuts from March and a lowered policy rate by year-end. Currently, the Fed Funds futures market anticipates five 25 basis point rate cuts this year, starting in March, with a 66.4% likelihood of a rate cut in March and a 62.1% chance it will be 25 basis points.
Summary of this S&P 500 technical analysis report:
- The S&P 500 formed a bearish rejection candle last week, failing to hit new highs and breaking below the previous week's low of 4,751. This suggests potential for further declines, with the next major support at 4,606.75. Despite this, long-term trends remain positive.
- On the daily chart, the S&P 500 is near a support level of 4,692. A move above this could lead to a rally towards 4,748, but breaking below might target 4,606.75. The trend is upwards, as indicated by the moving averages, but the bearish weekly candle and oversold stochastic oscillator suggest short-term challenges.
- The 8-hour chart shows resistance at 4,722.75 and 4,751, with the market at a critical juncture. A break below the 4,692 support could signal a topping formation, potentially leading the market down to the 4,626.75 support level.
Read the full S&P 500 technical analysis report below.
S&P 500 technical analysis
Weekly S&P 500 technical analysis
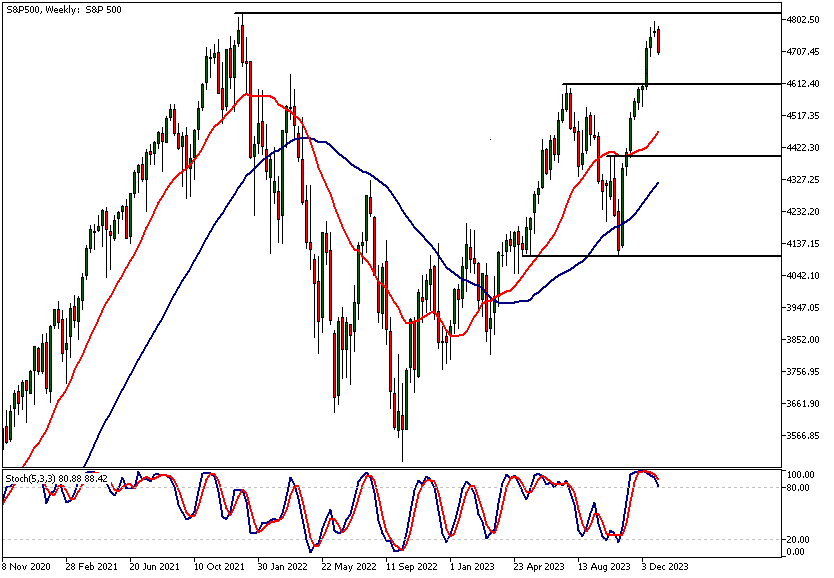
The S&P 500 was unable to reach new all-time highs. Instead the index formed a bearish rejection candle last week, leading to a decline in prices. With the market having broken below last week's low at 4,751, there appears to be potential for further downside.
The next major weekly support level is at 4,606.75, roughly 1.9% lower than the current market price. Indicator-based S&P 500 technical analysis also suggests lower prices ahead, with the stochastic oscillator giving a sell signal after turning lower in the overbought area. However, it's important to note that the long-term market trend remains positive.
Daily S&P 500 technical analysis
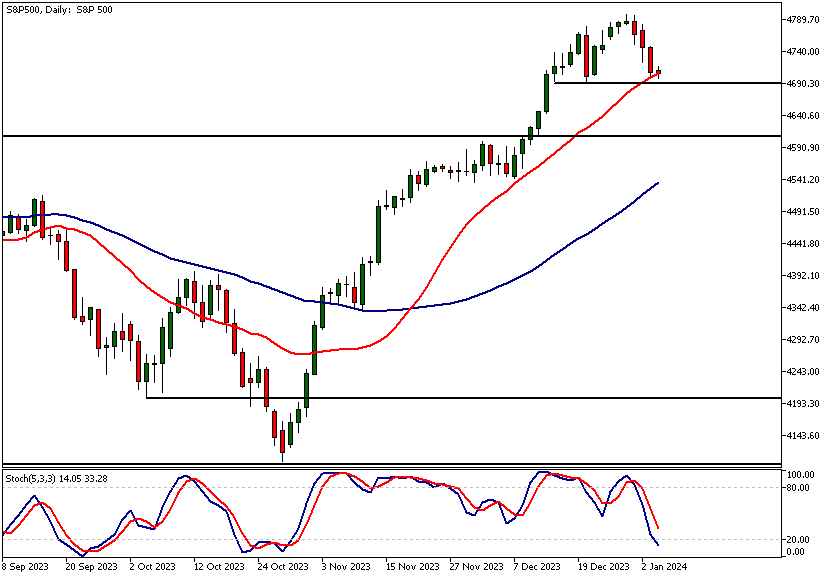
The daily time frame chart shows the S&P 500 trading near the support level of 4,692. Above this level, the market might rally to 4,748, while a decisive break below could lead to a move towards 4,610.
Moving averages-based S&P 500 technical analysis indicates that the market is still in an uptrend, as the moving average points higher and the fast 20-period moving average is above the slow 50-period moving average.
However, the stochastic oscillator is in the oversold area, suggesting the market could be short-term oversold. Nonetheless, the bearish weekly rejection candle above the current market price could limit the S&P 500's upside potential.
Intraday S&P 500 technical analysis
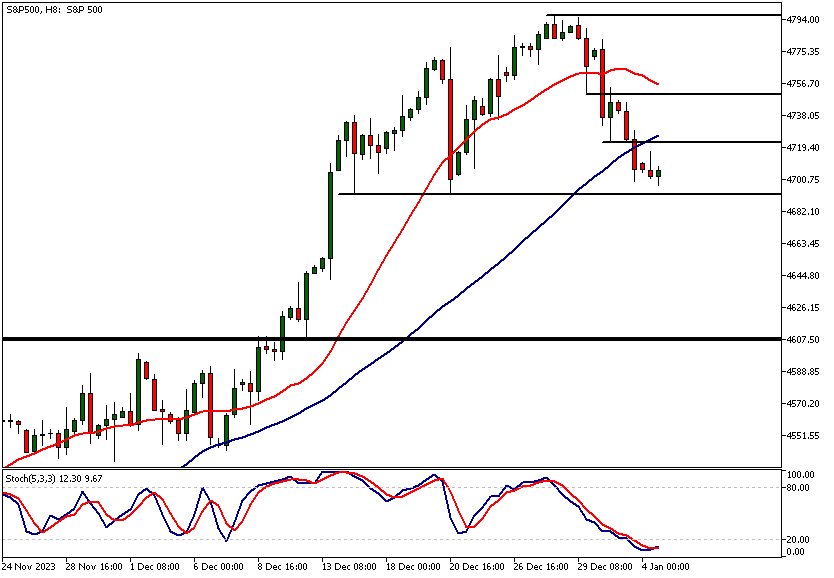
The 8-hour chart highlights resistance levels at 4,722.75 and 4,751. The higher level, being last week's low, is a significant reference point for short-term traders. Note that the resistance level at 4,722.75 is closely aligned with the 50-period moving average, which currently stands at 4,726.
Our S&P 500 technical analysis shows that the market is at a pivotal level. If the 4,692 support level breaks, the market may have formed a topping pattern in this timeframe and could trade down to the 4,610 or so.
Client sentiment analysis
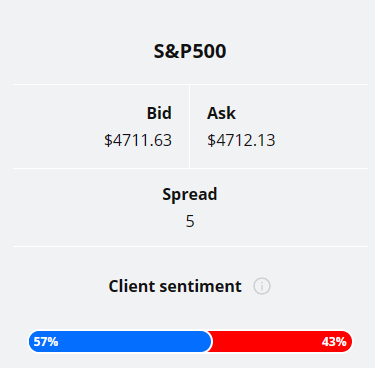
57% of clients trading S&P 500 are holding long positions, while 43% are holding short positions. Client sentiment data is being provided by TIO Markets Ltd.
It’s good to remember that retail client trading sentiment is a contrarian indicator as most retail traders are on average trading against market price trends. This is why experienced traders tend to trade against the retail client sentiment. You can follow the TIOmarkets client sentiment live on our Forex dashboard.
The next key risk events impacting this market:
- Average Hourly Earnings m/m
- Non-Farm Employment Change
- ISM Services PMI
- FOMC Member Barkin Speaks
Potential S&P 500 Market Moves
If the S&P 500 remains above the daily support level of 4,692 and the stochastic oscillator rebounds from the oversold area, a rally towards 4,748 could be anticipated, reflecting the ongoing uptrend shown by the moving averages. Alternatively, a decisive break below the 4,692 support level, coupled with the bearish weekly candle, could lead to a downward move towards 4,610.

How would you trade the S&P 500 today?
I hope this S&P 500 technical analysis report helps you to make better informed trading decisions. Check the latest market analysis for other instruments and subscribe to receive them in your inbox as soon as they are published
DISCLAIMER: TIO Markets offers an exclusively execution-only service. The views expressed are for information purposes only. None of the content provided constitutes any form of investment advice. The comments are made available purely for educational and marketing purposes and do NOT constitute advice or investment recommendation (and should not be considered as such) and do not in any way constitute an invitation to acquire any financial instrument or product. TIOmarkets and its affiliates and consultants are not liable for any damages that may be caused by individual comments or statements by TIOmarkets analysis and assumes no liability with respect to the completeness and correctness of the content presented. The investor is solely responsible for the risk of his/her investment decisions. The analyses and comments presented do not include any consideration of your personal investment objectives, financial circumstances, or needs. The content has not been prepared in accordance with any legal requirements for financial analysis and must, therefore, be viewed by the reader as marketing information. TIOmarkets prohibits duplication or publication without explicit approval.
Join us on social media

Janne Muta holds an M.Sc in finance and has over 20 years experience in analysing and trading the financial markets.
Related Posts


Trade responsibly: CFDs are complex instruments and come with a high risk of losing all your invested capital due to leverage.