S&P 500 Technical Analysis | Strong rally into new all-time highs
BY Janne Muta
|January 22, 2024S&P 500 Technical Analysis - On Friday the market rally was led by technology stocks, with significant gains in the main indices: the S&P 500 rose by 0.9%, the Nasdaq Composite increased by 1.3%, and the Dow Jones Industrial Average gained 0.5%. The information-technology sector surged 2%, driven by optimistic forecasts from Taiwan Semiconductor.
The economy demonstrated strength as initial jobless claims fell to a level not seen since September 2022. This development shifted investor expectations about Federal Reserve interest rate cuts, decreasing the likelihood of a cut in March from 70% to 43.5%.
Consumer confidence in the US showed signs of improvement, with the University of Michigan’s consumer-confidence index rising to 78.8 in January, up from 69.7 in December, exceeding economist predictions. Inflation expectations for the following year decreased to 2.9%, the lowest since the end of 2020.
As the US prepares to release its first estimate of Q2 GDP, forecasts vary from 1.5% to 2.4%. The Federal Reserve's growth estimate is set at 1.8%. Recent statements from Federal Reserve officials, coupled with positive GDP forecasts for Q4 2023, have lowered the likelihood of a rate hike in March to under 50%. This represents a significant shift in market expectations compared to January 12, 2023, when the probability of a rate cut for March was at 70%.
Summary of this S&P 500 technical analysis report:
- The market rallied to new all-time highs on Friday and is now approaching the top of a long-term bullish channel, currently at 4,912. The nearest key support levels are at 4,606, 4,663, 4,797 and 4,817. S&P 500 technical analysis suggests the market could remain bullish above these levels.
- The market broke out of a bullish triangle on Friday, moving into new all-time highs. This breakout from the continuation pattern suggests potential for further upside. The pattern's size gives a measured move target at 4,912. In technical analysis, such targets, derived from price formations, are often seen as minimum objectives.
- The 4-hour chart displays a strong rally, confirming the bullish indications from other time frames and technical indicators. S&P 500 technical analysis suggests robust upside momentum following the breakout. In a scenario where the market retraces lower and fails to attract renewed buying around the 4,800 level, a minor market structure level at 4,784 could be the next focus. Below this, a move down to 4,745 should be watched for.
Read the full S&P 500 technical analysis report below.
S&P 500 technical analysis
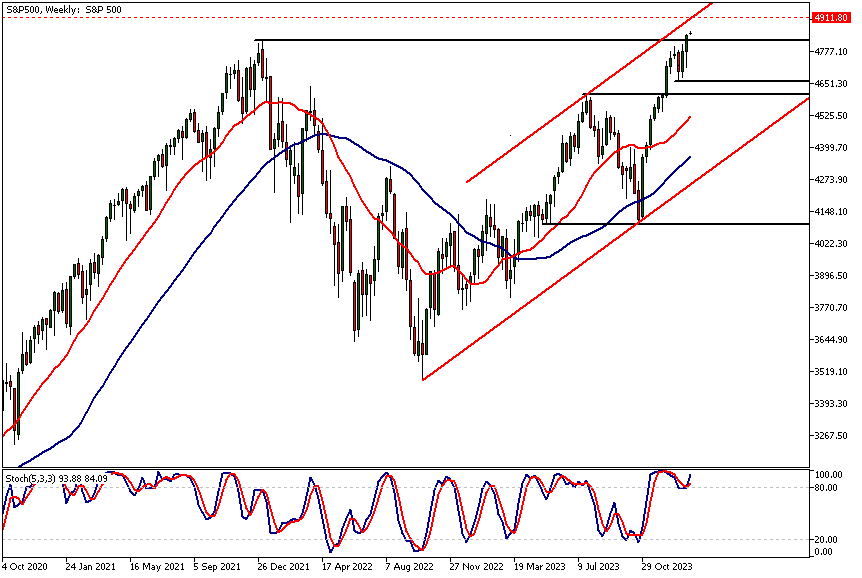
Weekly S&P 500 technical analysis
The market rallied to new all-time highs on Friday and is now approaching the top of a long-term bullish channel, currently at 4,912. This aligns with a measured move target, to be discussed in the S&P 500 daily technical analysis section below.
With the bull channel top relatively close to the current market price, the risk of technical corrections might have increased. Should the market correct lower and test the nearest support levels, look for signs of institutional buying before considering long trades. The nearest key support levels are at 4,606, 4,663, 4,797 and 4,817. S&P 500 technical analysis suggests the market could remain bullish above these levels.
The long-term chart remains bullish, with the moving averages trending upwards. The 20-period SMA is above the 50-period SMA, and both averages are inclining. The stochastic oscillator is above the overbought threshold of 80.
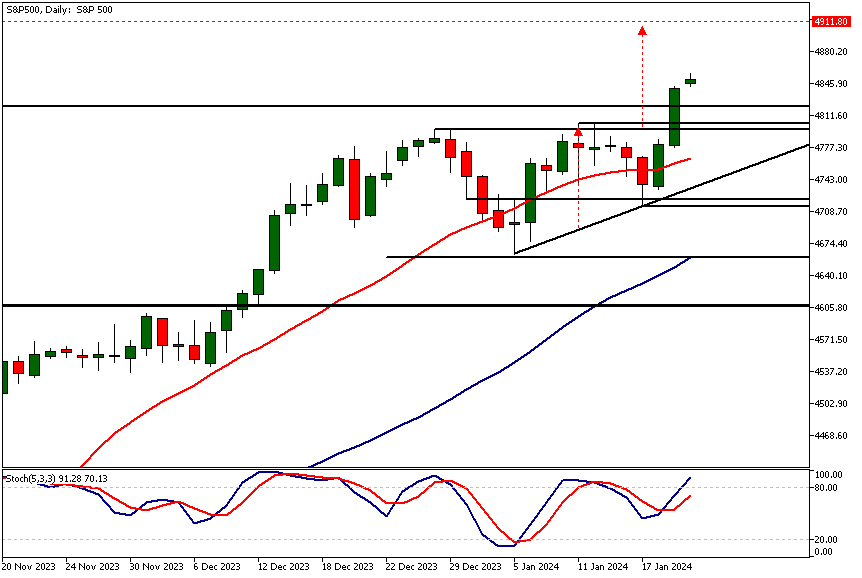
Daily S&P 500 technical analysis
The market broke out of a bullish triangle on Friday, moving into new all-time highs. This breakout from the continuation pattern suggests potential for further upside. The pattern's size gives a measured move target at 4,912. In technical analysis, such targets, derived from price formations, are often seen as minimum objectives.
These targets, calculated from the pattern's size, offer an estimate of the potential price movement following pattern confirmation. Traders frequently use these targets for setting profit-taking levels, though it's not uncommon for prices to surpass these targets.
Moving averages-based S&P 500 technical analysis also signal bullish market conditions, with the SMA 20 positioned above the SMA 50. Therefore, in the event of market retracement, the nearest support levels (4,663, 4,714, 4800, and 4,817) may attract buyers. Below 4663 look for a move down to 4,600.
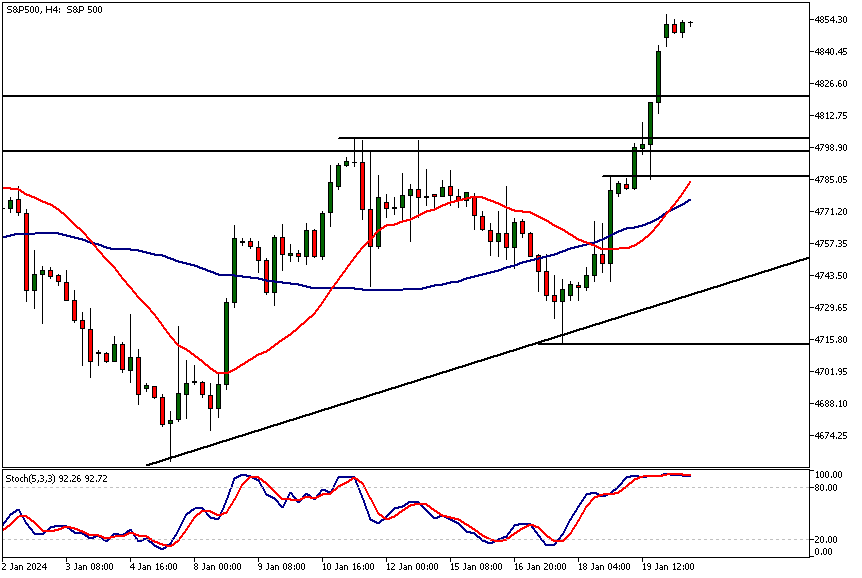
Intraday S&P 500 technical analysis
The 4-hour chart displays a strong rally, confirming the bullish indications from other time frames and technical indicators. S&P 500 technical analysis suggests robust upside momentum following the breakout. Consequently, traders should closely monitor price action at key levels in case the market retests them.
Alternatively, if the market continues to climb without a significant pullback, traders will need to focus on minor intraday time frames to identify key price levels as they develop.
In a scenario where the market retraces lower and fails to attract renewed buying around the 4,800 level, a minor market structure level at 4,784 could be the next focus. Below this, a move down to 4,745 should be watched for.
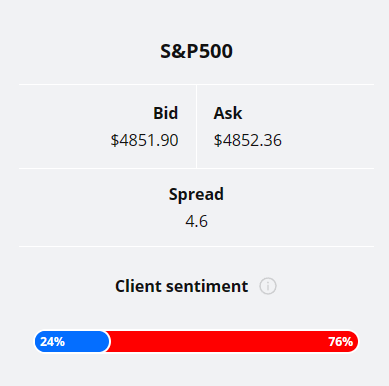
Client sentiment analysis
24% of clients trading S&P 500 are holding long positions, while 76% are holding short positions. Client sentiment data is being provided by TIO Markets Ltd.
Please note that retail client trading sentiment is often said to be a contrarian indicator. This is because trade data suggests that private (non-professional) traders, on average, trade against market price trends. You can follow the TIOmarkets client sentiment live on our Forex dashboard.
The next key risk events impacting this market:
- USD - Richmond Manufacturing Index
- USD - Flash Manufacturing PMI
- USD - Flash Services PMI
- USD - Advance GDP q/q
- USD - Unemployment Claims
- USD - Advance GDP Price Index q/q
- USD - Core Durable Goods Orders m/m
- USD - Durable Goods Orders m/m
- USD - New Home Sales
- USD - Core PCE Price Index m/m
- USD - Pending Home Sales m/m
Potential S&P 500 Market Moves
S&P 500 technical analysis indicates a bullish market, with the SMA 20 above the SMA 50. Key support levels at 4,663, 4,714, 4,800, and 4,817 could draw buyers if the market retraces. A further drop below 4,663 might lead to 4,600.
Strong upside momentum suggests monitoring key levels for potential retests. If the market doesn't find support around 4,800, it may test 4,784, then possibly 4,745. Traders should also watch minor intraday levels. (69 words)

How Would You Trade the S&P 500 Today?
I hope this S&P 500 technical analysis report helps you to make better informed trading decisions. Check the latest market analysis for other instruments and subscribe to receive them in your inbox as soon as they are published
DISCLAIMER: TIO Markets offers an exclusively execution-only service. The views expressed are for information purposes only. None of the content provided constitutes any form of investment advice. The comments are made available purely for educational and marketing purposes and do NOT constitute advice or investment recommendation (and should not be considered as such) and do not in any way constitute an invitation to acquire any financial instrument or product. TIOmarkets and its affiliates and consultants are not liable for any damages that may be caused by individual comments or statements by TIOmarkets analysis and assumes no liability with respect to the completeness and correctness of the content presented. The investor is solely responsible for the risk of his/her investment decisions. The analyses and comments presented do not include any consideration of your personal investment objectives, financial circumstances, or needs. The content has not been prepared in accordance with any legal requirements for financial analysis and must, therefore, be viewed by the reader as marketing information. TIOmarkets prohibits duplication or publication without explicit approval.

Janne Muta holds an M.Sc in finance and has over 20 years experience in analysing and trading the financial markets.
Related Posts


Trade responsibly: CFDs are complex instruments and come with a high risk of losing all your invested capital due to leverage.