S&P 500 Technical Analysis | The market surges 8.7% in November
BY Janne Muta
|November 23, 2023S&P 500 Technical Analysis - The stock market returns have been substantial over the last four weeks as highlighted by the S&P 500's 8.7% rise in November. The index has returned to investors 19% year-to-date. Yesterday 10 out of 11 S&P 500 sectors finished the day higher, led by telecommunication services and consumer staples.
The VIX index is nearing a critical support level at 12.68, indicating reduced market fears and could be soon reaching levels not seen since January 2020. A major contributor to this market upswing is the decrease in bond yields, that has made equities more appealing than bonds, leading to widespread gains in the US stock market.
Unemployment claims fell to 209K yesterday, reflecting a stronger labour market with the four-week average also decreasing. This is contrasted by stagnant core durable goods orders and a 5.4% drop in overall durable goods orders, hinting at cautious business investment and potential manufacturing slowdowns.
However, a slight rise in consumer sentiment to 61.3 suggests increasing consumer confidence, which may positively influence consumer spending.
Summary of this S&P 500 technical analysis report:
- The S&P 500 index has rallied 11% in just four weeks. This substantial rally is a rare event, and based on our study, such periods are followed by substantial upside and/or downside volatility. Therefore, the coming weeks are likely to provide many short-term trading opportunities on both sides of the market.
- The daily chart shows the market rallying over 5% since the breakout of a bearish trend channel at the beginning of the month. The 4524 market structure level is the nearest key support level, and the market could be targeting the 4607 YTD high above it. Below 4524, look for a move to 4490.
- The S&P 500 trend in the 4-hour chart is quite strong, with the market creating higher lows and higher highs. The indicator-based S&P 500 technical analysis suggests the same, as the 20-period moving average has been acting as a dynamic support to the market, and the market is currently trading above the indicator line.
Read the full S&P 500 technical analysis report below.
S&P 500 technical analysis
Weekly S&P 500 technical analysis
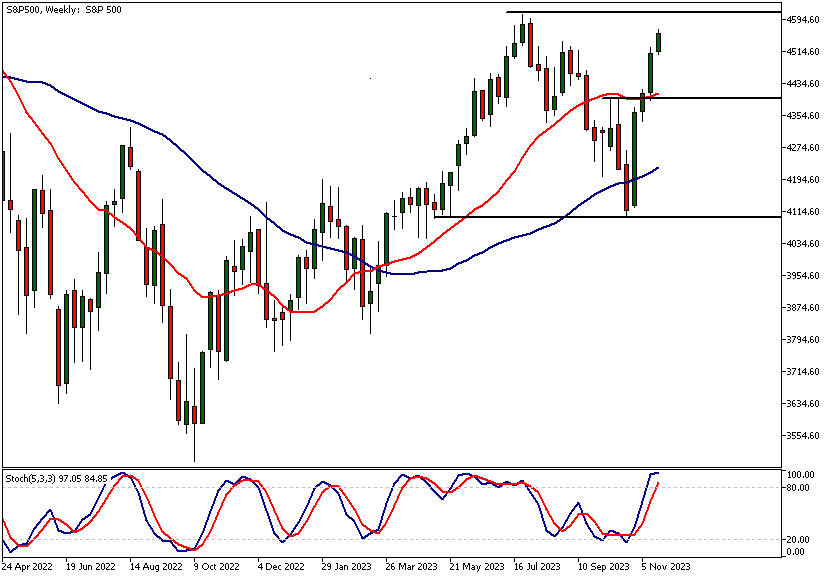
The S&P 500 index has rallied 11% in just four weeks. This substantial rally is a rare event, and based on our study, such periods are followed by substantial upside and/or downside volatility. Therefore, the coming weeks are likely to provide many short-term trading opportunities on both sides of the market.
After rallying higher by 11%, the market is only about 1.2% from the year-to-date (YTD) high at 4607. Therefore, the immediate upside in this market could be getting limited. However, this doesn't mean the market cannot exceed or would be unlikely to exceed the YTD high.
Instead, based on our research, the returns after strong moves like this are likely to be much more moderate than the ones just witnessed.
Increased market volatility
However, while returns for those who buy and hold could be limited in light of past data, the data also shows that such rallies are often followed by increased market fluctuations. Therefore, over the coming weeks, short-term traders could benefit more from the market than investors.
The nearest key support level on the weekly chart is at 4393 and coincides with the 20-period moving average. The nearest major resistance level is the YTD high at 4607.
Moving average analysis
Indicator-based S&P 500 technical analysis is in line with our market structure analysis, as it indicates that the market is bullish with the 20-period moving average above the 50-period SMA.
The stochastic oscillator has moved into the overbought area, indicating that the market could be nearing levels where the upside might be getting limited. This also aligns with our market structure analysis.
Daily S&P 500 technical analysis
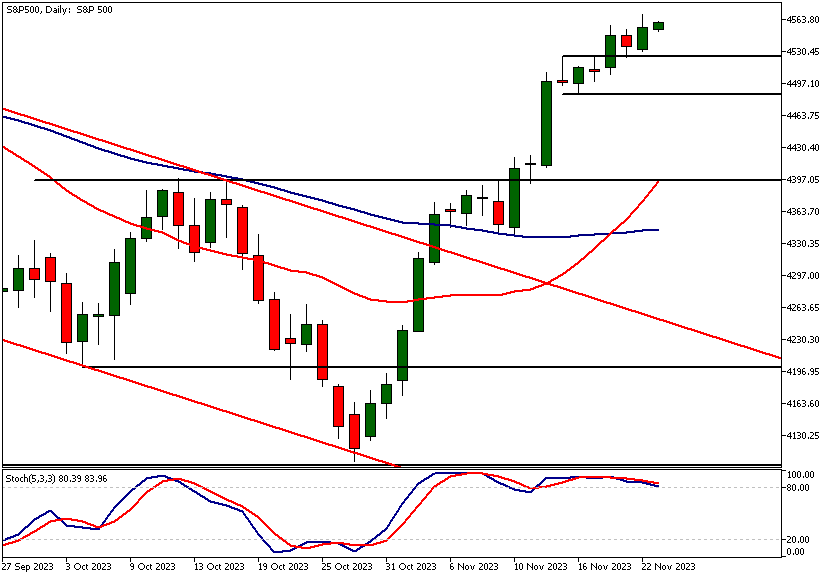
The daily chart shows the market rallying over 5% since the breakout of a bearish trend channel at the beginning of the month. The 4524 market structure level is the nearest key support level, and the market could be targeting the 4607 YTD high above it. Below 4524, look for a move to 4490.
Indicator-oriented S&P 500 technical analysis shows how the fast-moving average is above the slow, and the stochastic oscillator has been moving inside the overbought area for most of the rally.
Wider view of technical factors
This highlights the fact that traders should never focus on one indicator or technical analysis factor alone but rather pay attention to several factors, with momentum being the most important indicator.
S&P 500 technical analysis, 4h
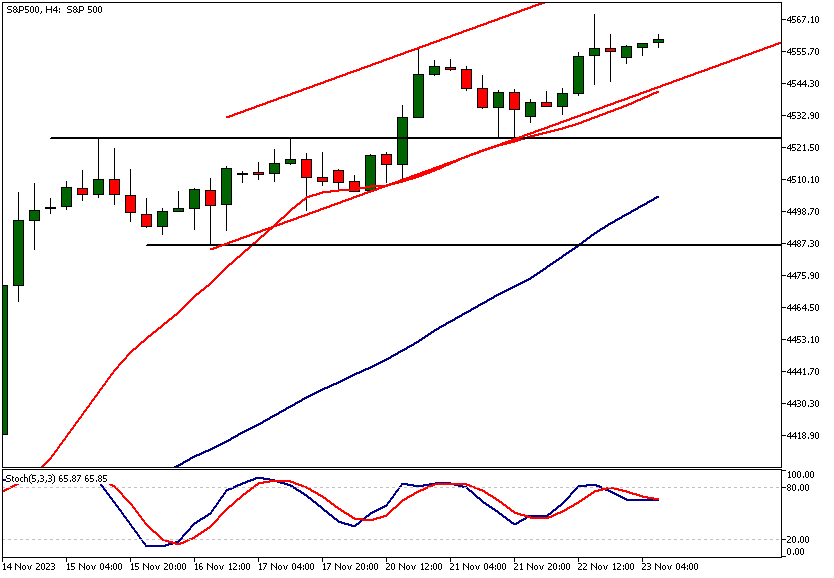
The S&P 500 trend in the 4-hour chart is quite strong, with the market creating higher lows and higher highs. The indicator-based S&P 500 technical analysis suggests the same, as the 20-period moving average has been acting as a dynamic support to the market, and the market is currently trading above the indicator line.
Also, the 20-period moving average is well above the 50-period SMA, which also points higher, suggesting that the market has strong momentum.
The key price levels
The key support levels below the price are the same as in the daily chart, with the nearest level at 4524. Should it fail to attract buyers, we could see the market moving down to 4495 or so. The market bias remains bullish above the 4487 support level. Should there be a decisive break below 4487, we could see a move down to 4430.
Client sentiment analysis
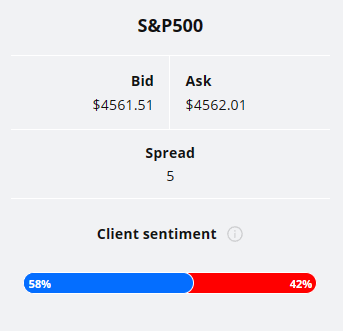
The TIOmarkets client sentiment graph shows that traders as a whole aren't strongly committed to either side of the market. 58% of traders are long and 42% are short the market.
Please remember that the retail trader client sentiment is a contrarian indicator as most of the retail traders are on average betting against the market trends. This is why, experienced traders tend to trade against the retail client sentiment. You can follow the TIOmarkets client sentiment live on our Forex dashboard.
The next key risk events impacting this market:
- US Flash Manufacturing PMI
- US Flash Services PMI
- US CB Consumer Confidence
- US GDP
Potential S&P 500 Market Moves
The daily chart shows the market rallying over 5% since the breakout of a bearish trend channel at the beginning of the month. The 4524 market structure level is the nearest key support level, and the market could be targeting the 4607 YTD high above it. Below 4524, look for a move to 4490.

How would you trade the S&P 500 today?
I hope this S&P 500 technical analysis report helps you to make better informed trading decisions. Check the latest market analysis for other instruments and subscribe to receive them in your inbox as soon as they are published
DISCLAIMER: TIO Markets offers an exclusively execution-only service. The views expressed are for information purposes only. None of the content provided constitutes any form of investment advice. The comments are made available purely for educational and marketing purposes and do NOT constitute advice or investment recommendation (and should not be considered as such) and do not in any way constitute an invitation to acquire any financial instrument or product. TIOmarkets and its affiliates and consultants are not liable for any damages that may be caused by individual comments or statements by TIOmarkets analysis and assumes no liability with respect to the completeness and correctness of the content presented. The investor is solely responsible for the risk of his/her investment decisions. The analyses and comments presented do not include any consideration of your personal investment objectives, financial circumstances, or needs. The content has not been prepared in accordance with any legal requirements for financial analysis and must, therefore, be viewed by the reader as marketing information. TIOmarkets prohibits duplication or publication without explicit approval.

Janne Muta holds an M.Sc in finance and has over 20 years experience in analysing and trading the financial markets.
Related Posts


Trade responsibly: CFDs are complex instruments and come with a high risk of losing all your invested capital due to leverage.