S&P 500 Technical Analysis | The market trades near the five-week high
BY Janne Muta
|November 9, 2023S&P 500 Technical Analysis - Yesterday declining stocks in NYSE outnumbered those that advanced (1,649 vs. 1,200) and the declining volume was almost double the advancing volume. It seems that with the S&P 500 index trading near five-week highs with bulls getting more careful by the day.
Only five S&P 500 sectors are positive at the time of writing with industrials (0.46%) and the communication services (0.50%) leading the gaining sectors. Health care (-1.22%) and consumer discretionary (-0.71%) stocks are losing the most.
Rising bond yields have pressured the technology stocks in this trading session. With the heaviest weight in tech stocks the S&P 500 index is feeling the pressure.
Summary of This S&P 500 Technical Analysis Report:
- The S&P 500 may encounter resistance at 4398; surpassing this could lead to 4466, but failure may result in a retreat to 4350.
- A shift from cautious buying to selling could see levels drop to around 4350, close to the 50-period moving average at 4341.
- A break below 4350 may lead to a retest of 4300, while a strong rally past 4398 could target the 4427-4430 range, a previous support zone.
Read the full S&P 500 technical analysis report below.
S&P 500 Technical Analysis
Weekly S&P 500 Technical Analysis
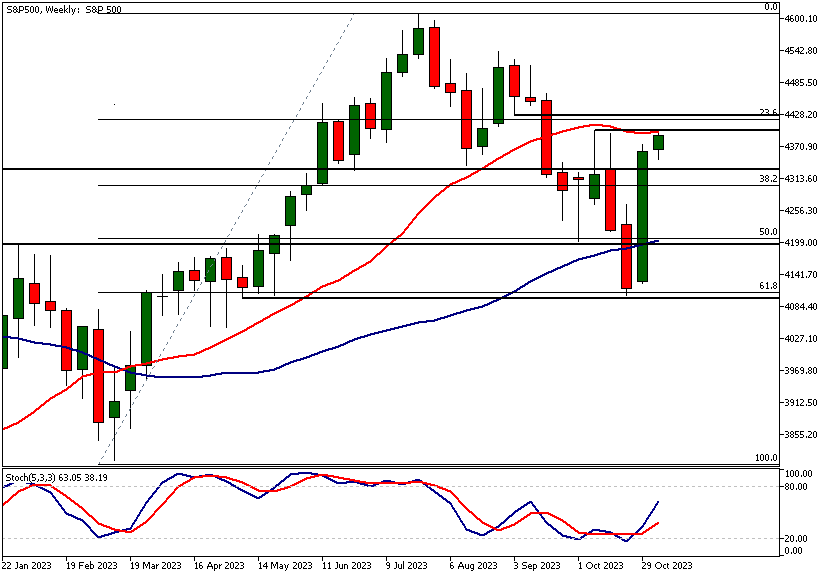
The S&P 500 Index has rallied 7% since the low two weeks ago. Now the market is approaching a key resistance level (4398) in the weekly time frame chart. The 4398 level coincides with the 20-period moving average.
This is where the sell-off started in October, so it is possible that there could still be supply above this price level. Alternatively, some traders might use this level to take some profits off the table, causing the market to either slow down or maybe even correct lower.
If the bulls are able to push the market decisively above the 4398 level, we could see the S&P 500 trading to 4466 or so. However, if the market becomes weak around this key price level, we could see it retracing back to 4350.
Daily S&P 500 Technical Analysis
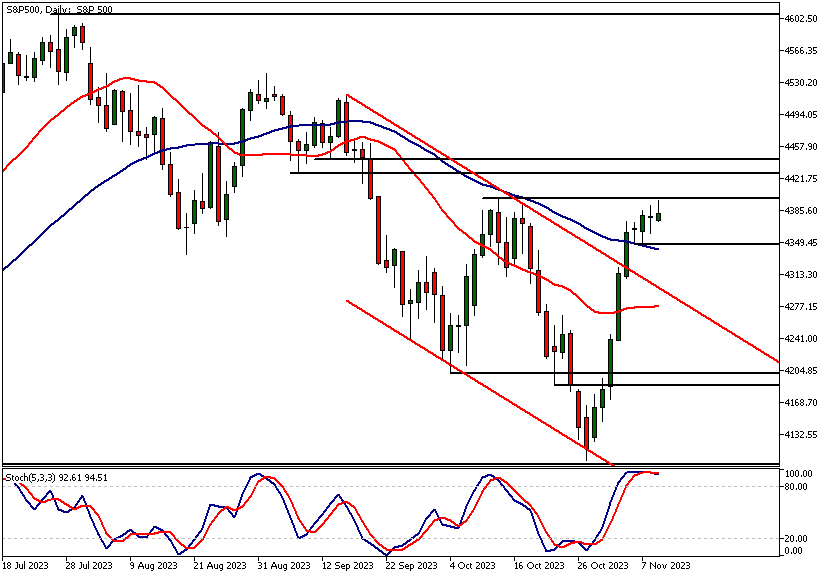
The daily chart shows the S&P 500 carefully approaching the 4398 resistance level, with the stochastic oscillator in the overbought area. This could be a sign that the bulls are not overly confident in their ability to push the market above the 4398 resistance level.
If this is the case and we see this careful buying turning into weakness, then the market might trade down to 4350. Note that the 50-period moving average is currently at 4341, and therefore not so far from this support level.
And if the 4350 level fails to attract buyers, the market might retest the bear channel top, which currently is 4300. Alternatively, a strong and decisive rally above 4398 could move the market to the 4427-4430 price range. This range is created by two market structure levels that used to support the market in September.
S&P 500 Technical Analysis, 4h
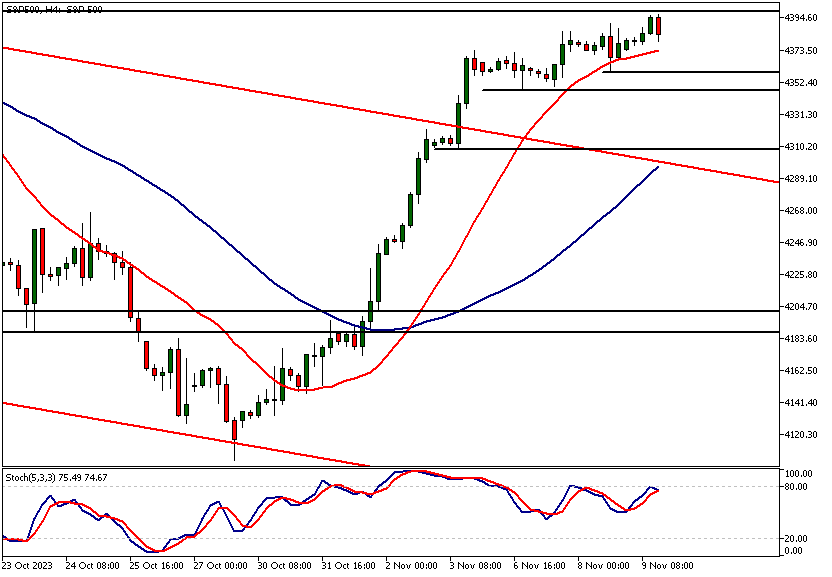
The 4-hour chart reveals a support level at 4359. With the current candle high at 4397, the index has almost touched the 4398 level and is reacting lower at the time of writing.
In order to keep on pushing higher, the market needs to create higher reactionary lows above either the 4350 or 4359 support levels. Such price action would indicate a willingness to keep pushing the market higher and possibly above the 4398 resistance level. However, if the market starts to break support levels, we could see a move down to 4308 or so.
Client sentiment analysis
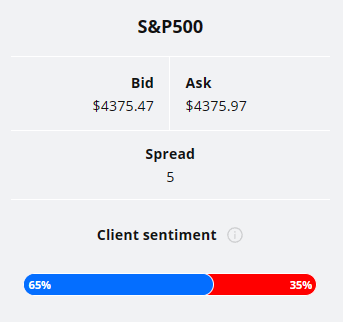
The TIOmarkets client sentiment graph shows 65% of traders are long and 35% are short the market.
Please remember that the retail trader client sentiment is a contrarian indicator as most of the retail traders are on average betting against the market trends. This is why, experienced traders tend to trade against the retail client sentiment. You can follow the TIOmarkets client sentiment live on our Forex dashboard.
The next key risk events impacting this market:
- USD - Fed Chair Powell's Speech
- USD - Prelim UoM Consumer Sentiment
- USD - Prelim UoM Inflation Expectations
- USD - CPI
Potential S&P 500 Market Moves
If the bulls are able to push the market decisively above the 4398 level, we could see the S&P 500 trading to 4466 or so.
However, if the market becomes weak around this key price level, we could see it retracing back to 4350.

How would you trade the S&P 500 today?
I hope this fundamental and technical S&P 500 analysis helps you to make better informed trading decisions. Check the latest market analysis for other instruments and subscribe to receive them in your inbox as soon as they are published
DISCLAIMER: TIO Markets offers an exclusively execution-only service. The views expressed are for information purposes only. None of the content provided constitutes any form of investment advice. The comments are made available purely for educational and marketing purposes and do NOT constitute advice or investment recommendation (and should not be considered as such) and do not in any way constitute an invitation to acquire any financial instrument or product. TIOmarkets and its affiliates and consultants are not liable for any damages that may be caused by individual comments or statements by TIOmarkets analysis and assumes no liability with respect to the completeness and correctness of the content presented. The investor is solely responsible for the risk of his/her investment decisions. The analyses and comments presented do not include any consideration of your personal investment objectives, financial circumstances, or needs. The content has not been prepared in accordance with any legal requirements for financial analysis and must, therefore, be viewed by the reader as marketing information. TIOmarkets prohibits duplication or publication without explicit approval.

Janne Muta holds an M.Sc in finance and has over 20 years experience in analysing and trading the financial markets.
Related Posts


Trade responsibly: CFDs are complex instruments and come with a high risk of losing all your invested capital due to leverage.